29
/
en
AIzaSyAYiBZKx7MnpbEhh9jyipgxe19OcubqV5w
April 1, 2024
79762
Barbados
BRB
true
2
1
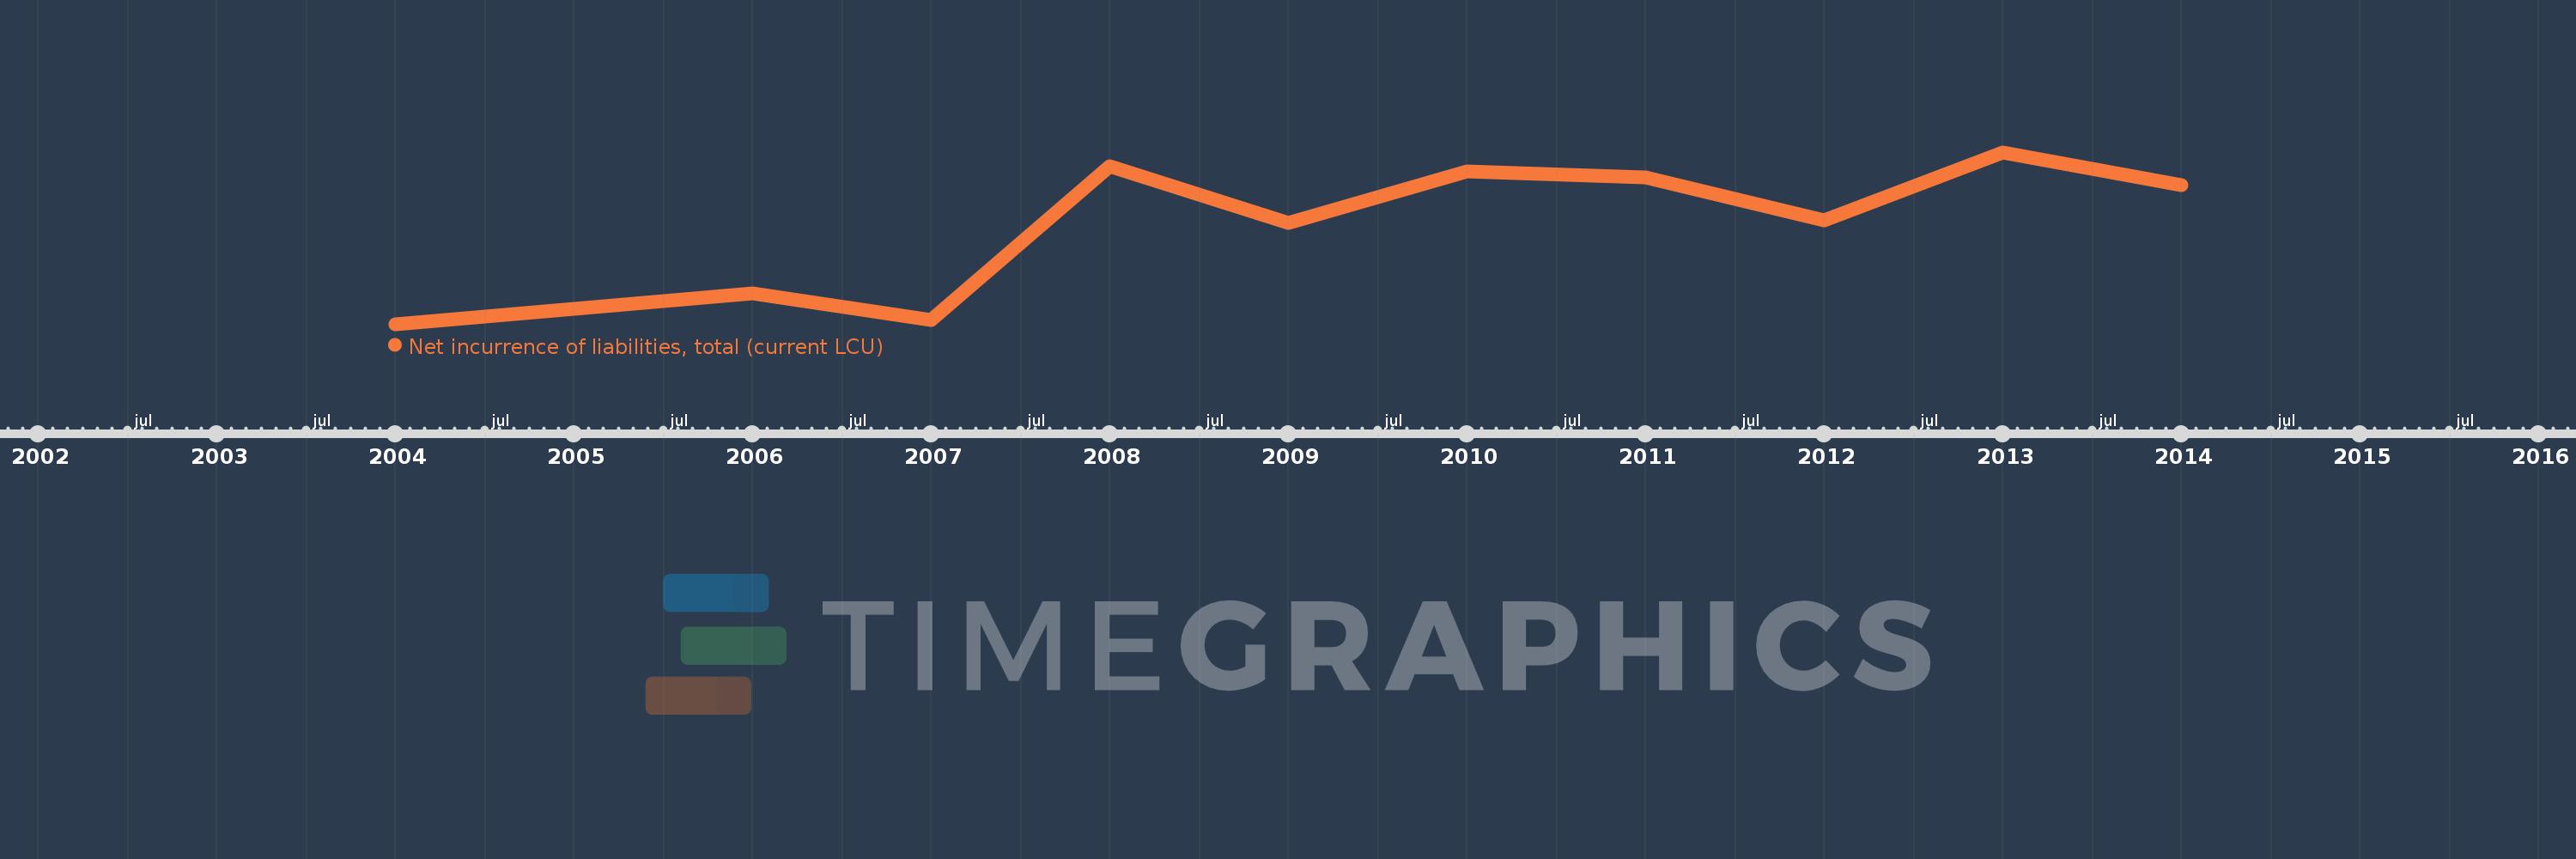
Net incurrence of liabilities, total (current LCU)
2014,2013,2012,2011,2010,2009,2008,2007,2006,2004
This statistics in other country:
Timeline:
This timeline shows a graph from 2004 to 2014 of Barbados. No data until 2003. Number of actual observations by date: 10.
Source name:
World Development Indicators
Source organization:
International Monetary Fund, Government Finance Statistics Yearbook and data files.
Categories, topics:
Public Sector
Last updated:
apr 23, 2017
Indicators value changes by year
Minimum:
66.842 mln
jan 1, 2004
Maximum:
1.065 bln
jan 1, 2013
At the date of observation
Value
Absolute change
Change from previous value
jan 1, 2004
66.842 mln
+66.842 mln
0.0%
jan 1, 2006
243.522 mln
+176.68 mln
264.32%
jan 1, 2007
90.592 mln
-152.93 mln
-62.8%
jan 1, 2008
986.368 mln
+895.776 mln
988.8%
jan 1, 2009
654.782 mln
-331.585 mln
-33.62%
jan 1, 2010
955.042 mln
+300.26 mln
45.86%
jan 1, 2011
917.475 mln
-37.566 mln
-3.93%
jan 1, 2012
671.876 mln
-245.6 mln
-26.77%
jan 1, 2013
1.065 bln
+392.763 mln
58.46%
jan 1, 2014
876.043 mln
-188.596 mln
-17.71%
Ranking of countries by current statistics by years


Comments: