29
/
en
AIzaSyAYiBZKx7MnpbEhh9jyipgxe19OcubqV5w
April 1, 2024
257611
Switzerland
CHE
true
2
1
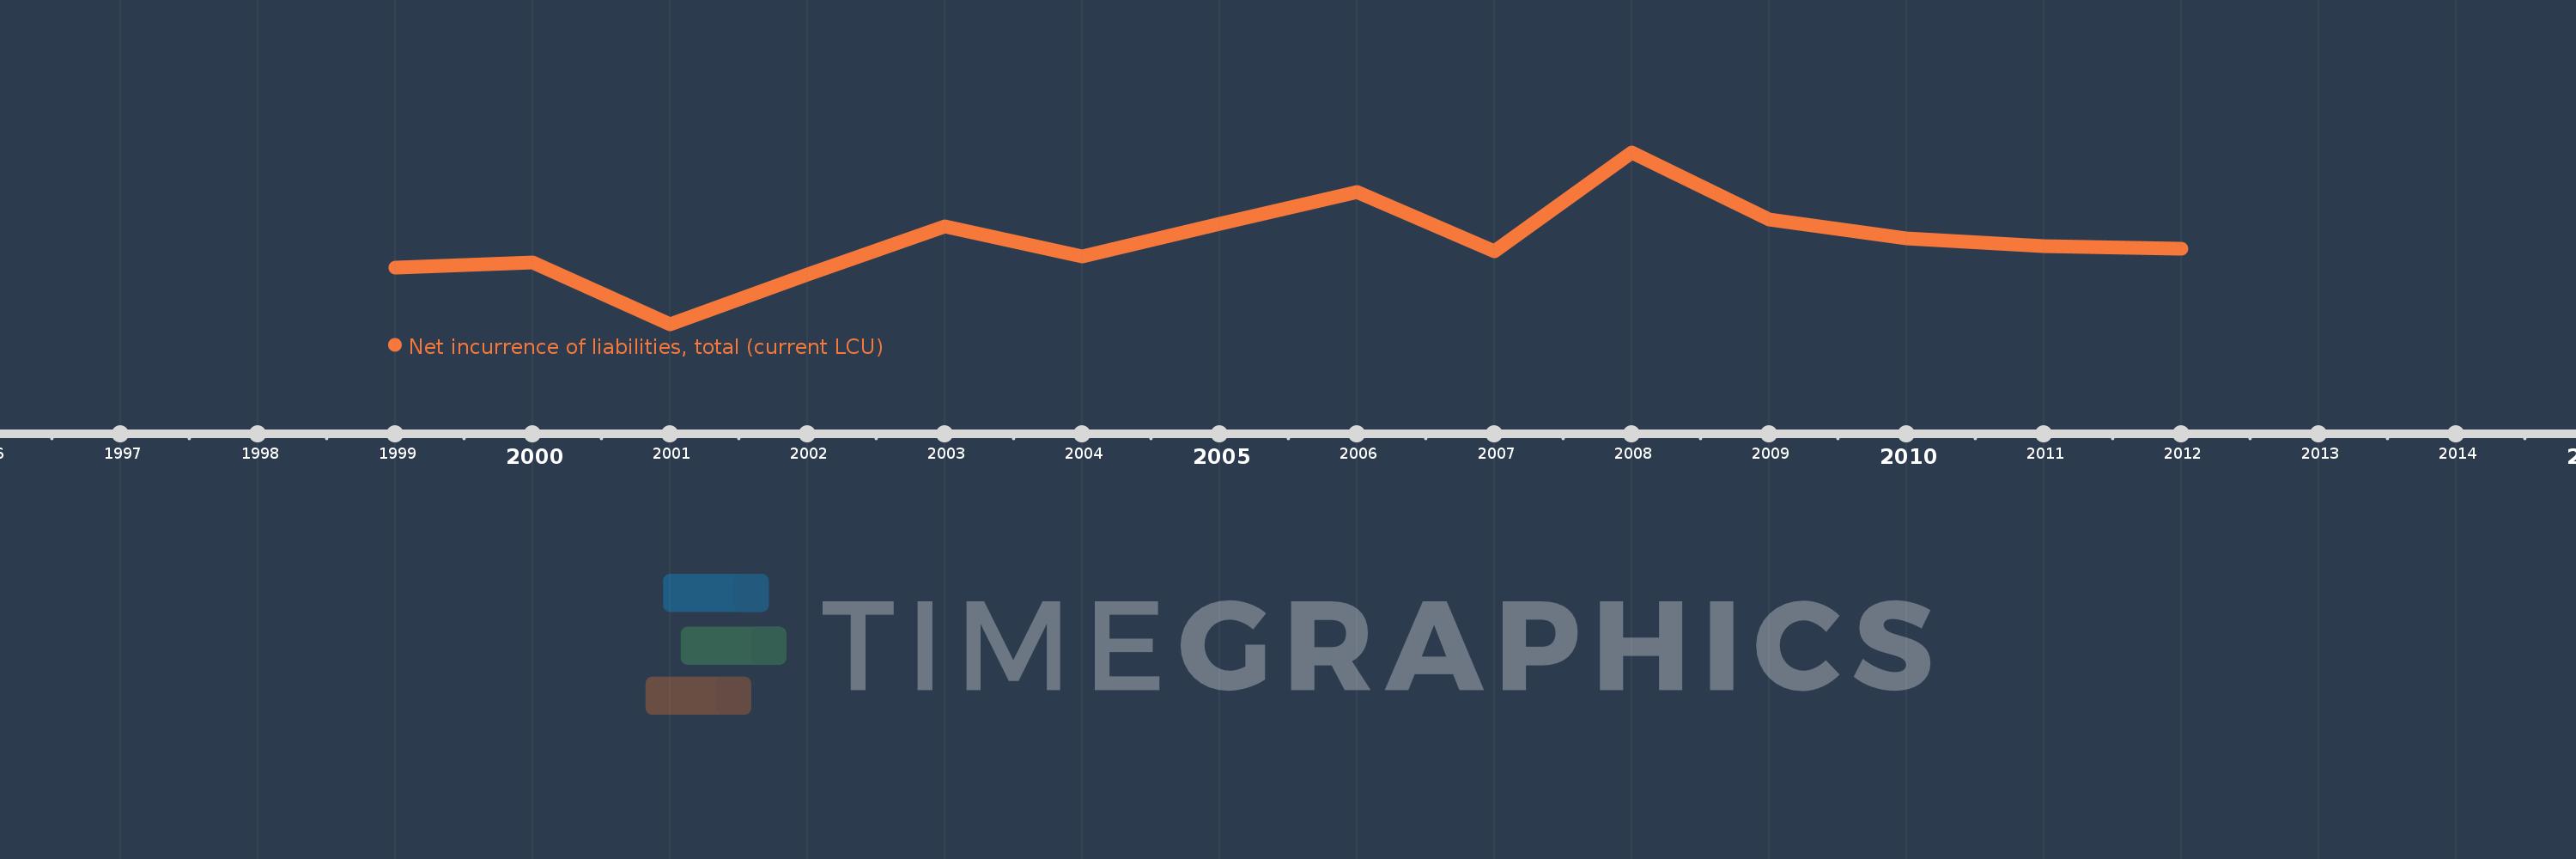
Net incurrence of liabilities, total (current LCU)
2012,2011,2010,2009,2008,2007,2006,2005,2004,2003,2002,2001,2000,1999
This statistics in other country:
Timeline:
This timeline shows a graph from 1999 to 2012 of Switzerland. No data until 1998. Number of actual observations by date: 14.
Source name:
World Development Indicators
Source organization:
International Monetary Fund, Government Finance Statistics Yearbook and data files.
Categories, topics:
Public Sector
Last updated:
apr 23, 2017
Indicators value changes by year
Minimum:
-11.945 bln
jan 1, 2001
Maximum:
18.356 bln
jan 1, 2008
At the date of observation
Value
Absolute change
Change from previous value
jan 1, 1999
-1.999 bln
-1.999 bln
0.0%
jan 1, 2000
-1.065 bln
+934.0 mln
-46.72%
jan 1, 2001
-11.945 bln
-10.88 bln
1.02K%
jan 1, 2002
-3.203 bln
+8.742 bln
-73.19%
jan 1, 2003
5.327 bln
+8.53 bln
-266.3%
jan 1, 2004
36.017 mln
-5.291 bln
-99.32%
jan 1, 2005
5.817 bln
+5.781 bln
16.05K%
jan 1, 2006
11.411 bln
+5.594 bln
96.17%
jan 1, 2007
955.22 mln
-10.456 bln
-91.63%
jan 1, 2008
18.356 bln
+17.401 bln
1.82K%
jan 1, 2009
6.532 bln
-11.824 bln
-64.41%
jan 1, 2010
3.24 bln
-3.292 bln
-50.4%
jan 1, 2011
1.862 bln
-1.378 bln
-42.52%
jan 1, 2012
1.38 bln
-482.157 mln
-25.89%
Ranking of countries by current statistics by years


Comments: