Download This statistics in other country:
Timeline:
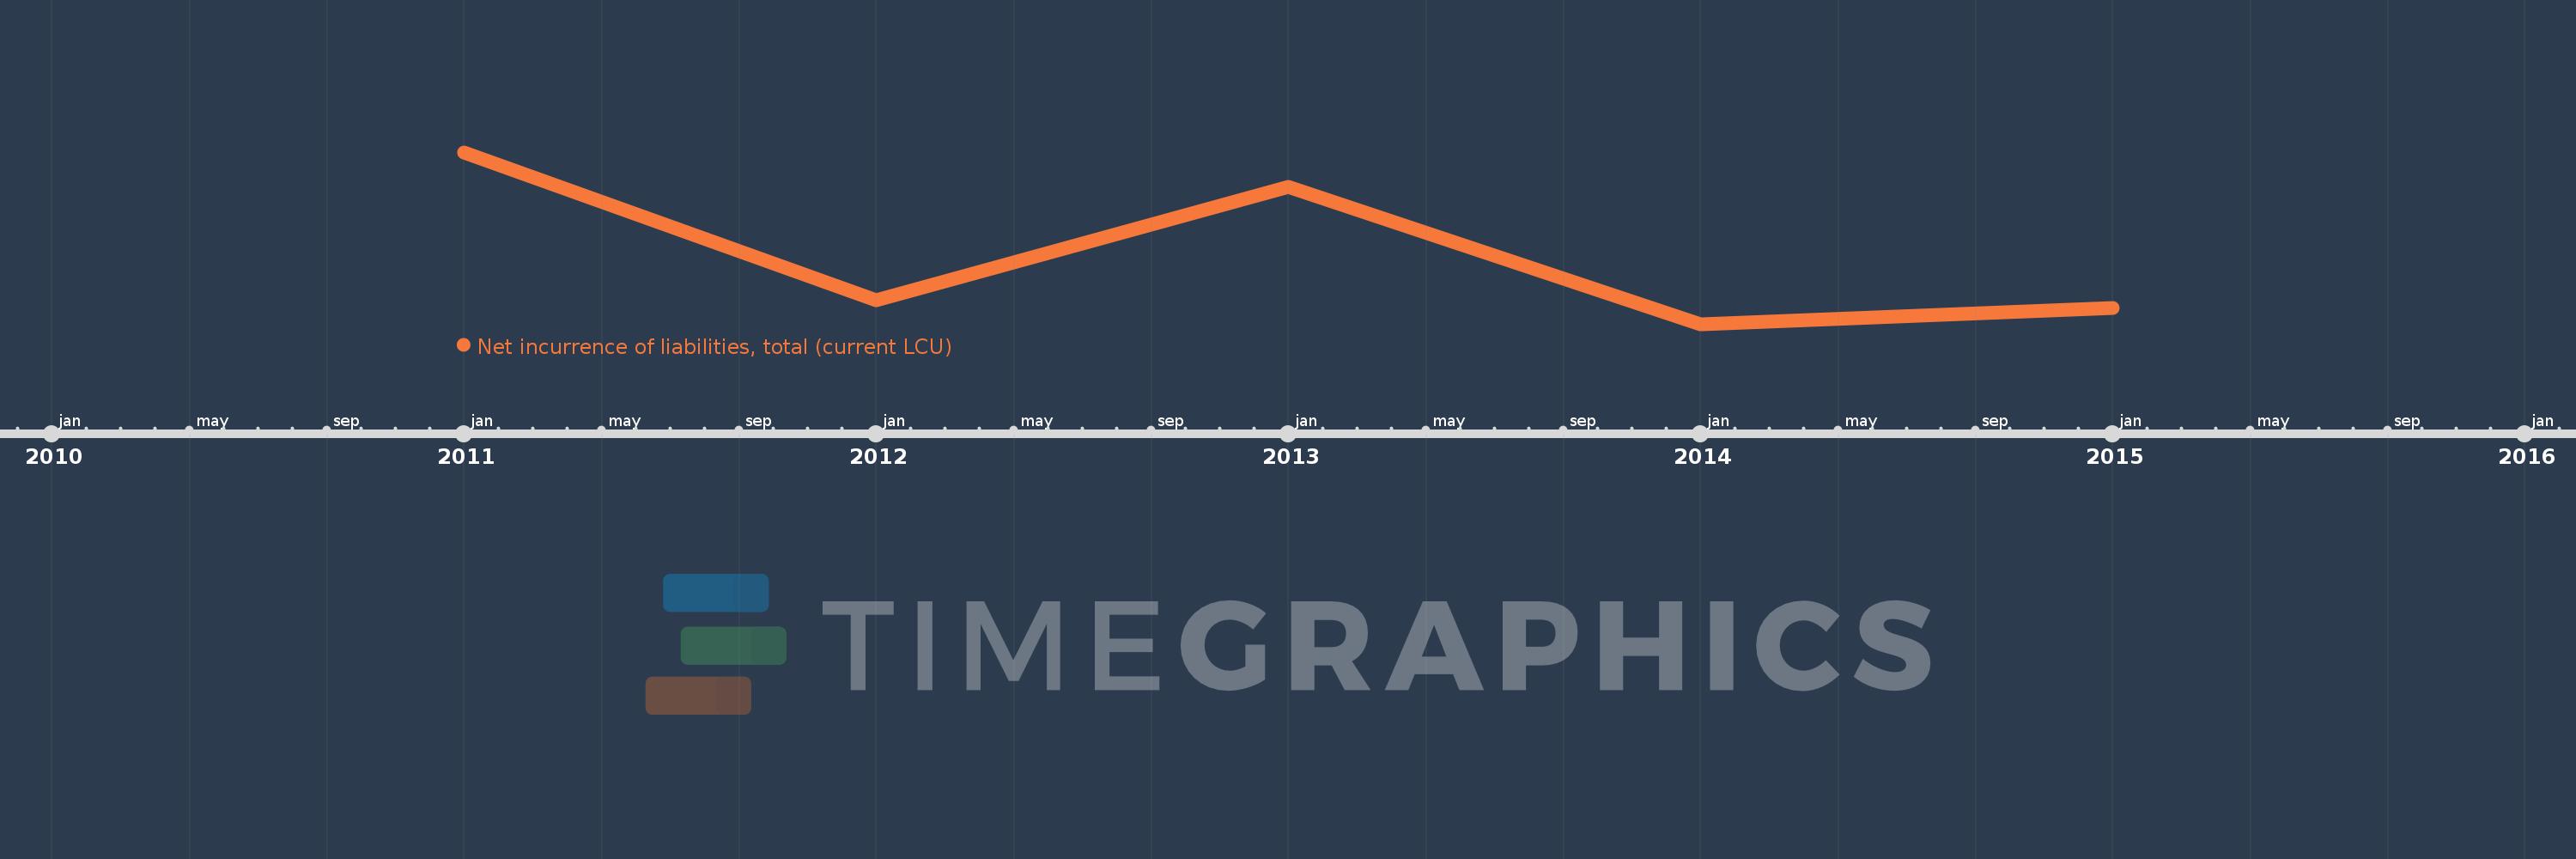
This timeline shows a graph from 2011 to 2015 of Samoa. No data until 2010. Number of actual observations by date: 5.
Source name:
World Development Indicators
Source organization:
International Monetary Fund, Government Finance Statistics Yearbook and data files.
Categories, topics:
Public Sector
Last updated:
apr 23, 2017
Indicators value changes by year
Minimum:
83.073 mln
jan 1, 2014
Maximum:
137.486 mln
jan 1, 2011
At the date of observation
Value
Absolute change
Change from the previous value
jan 1, 2011
137.486 mln
+137.486 mln
0.0%
jan 1, 2012
90.635 mln
-46.851 mln
-34.08%
jan 1, 2013
126.637 mln
+36.002 mln
39.72%
jan 1, 2014
83.073 mln
-43.564 mln
-34.4%
jan 1, 2015
88.297 mln
+5.225 mln
6.29%
Ranking of countries by current statistics by years
