29
/
en
AIzaSyAYiBZKx7MnpbEhh9jyipgxe19OcubqV5w
April 1, 2024
85123
Bermuda
BMU
true
2
1
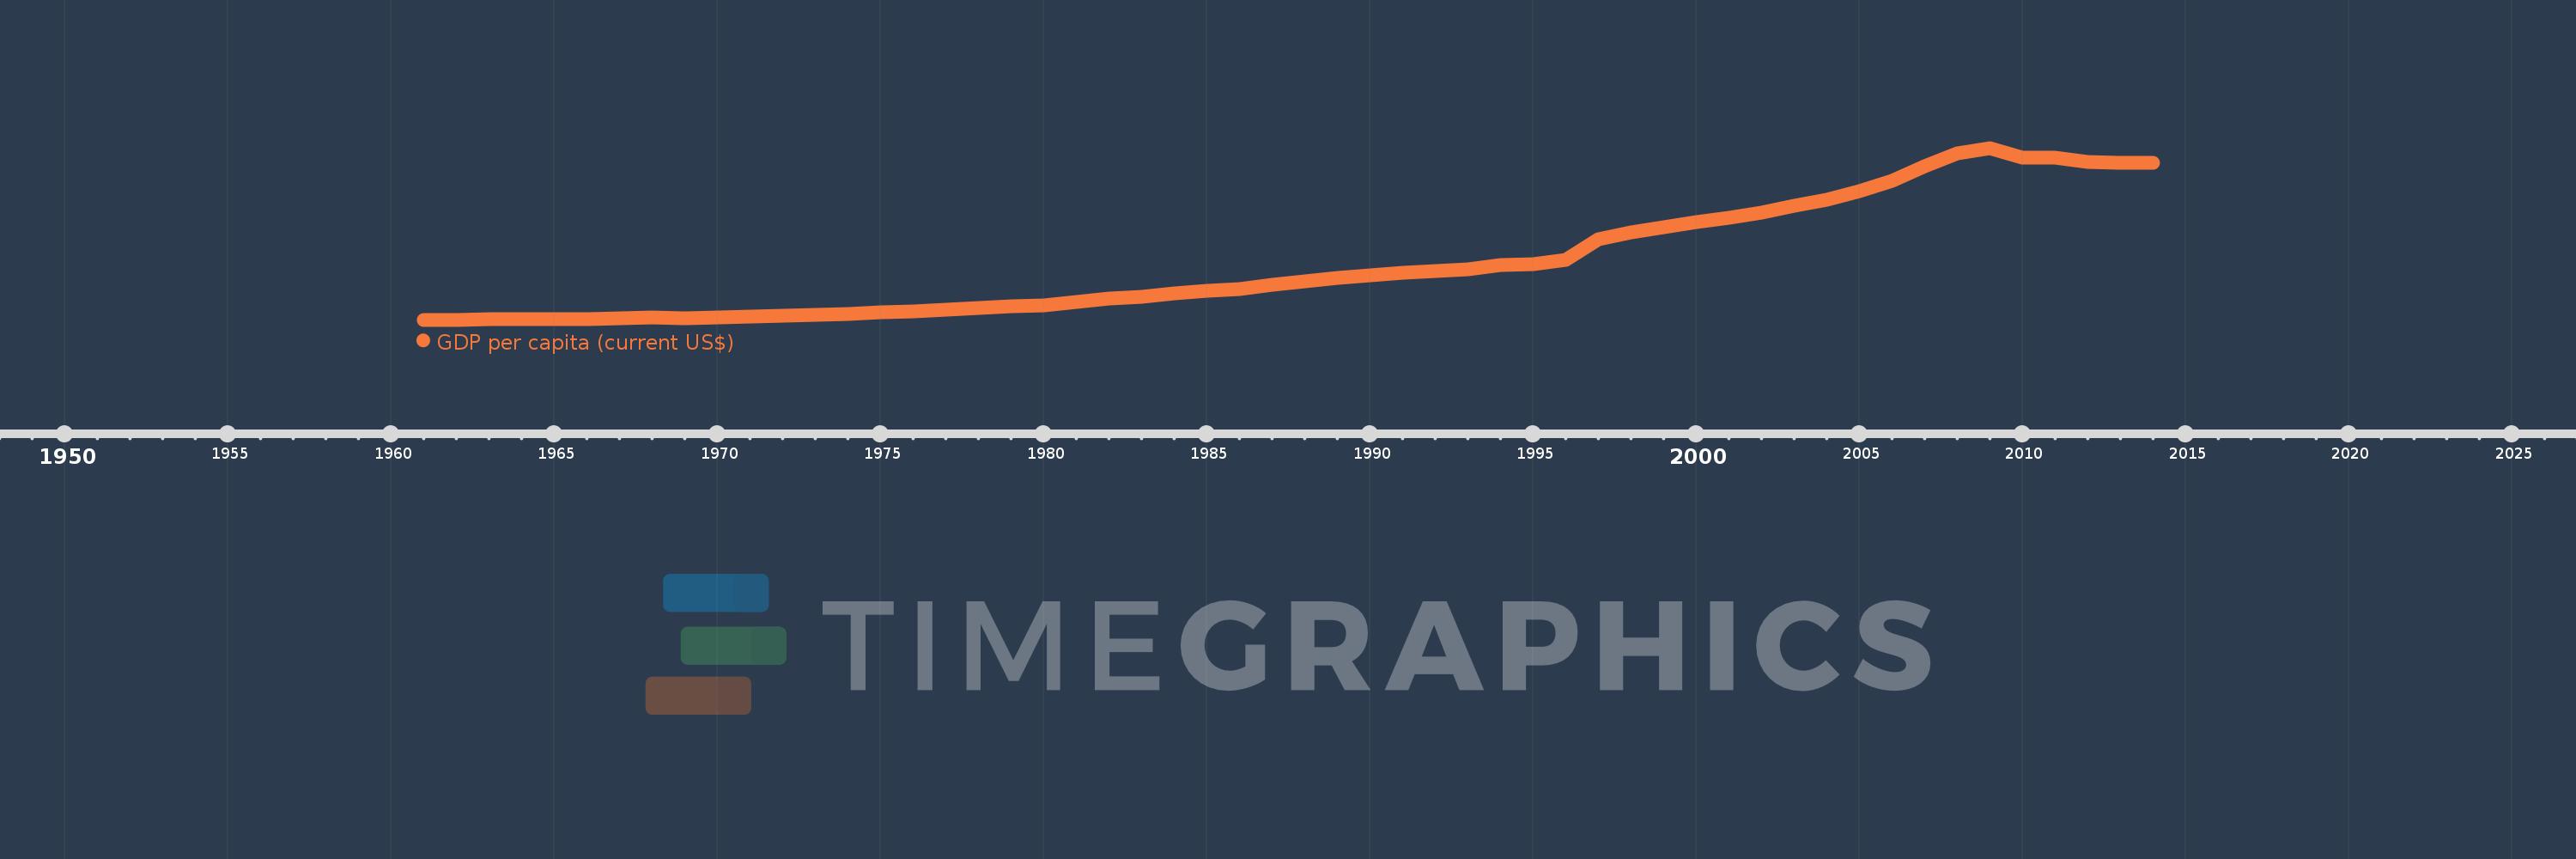
GDP per capita (current US$)
2014,2013,2012,2011,2010,2009,2008,2007,2006,2005,2004,2003,2002,2001,2000,1999,1998,1997,1996,1995,1994,1993,1992,1991,1990,1989,1988,1987,1986,1985,1984,1983,1982,1981,1980,1979,1978,1977,1976,1975,1974,1973,1972,1971,1970,1969,1968,1967,1966,1965,1964,1963,1962,1961
This statistics in other country:
AfghanistanAlbaniaAlgeriaAndorraAngolaAntigua and BarbudaArab WorldArgentinaArmeniaArubaAustraliaAustriaAzerbaijanBahamas, TheBahrainBangladeshBarbadosBelarusBelgiumBelizeBeninBermudaBhutanBoliviaBosnia and HerzegovinaBotswanaBrazilBrunei DarussalamBulgariaBurkina FasoBurundiCabo VerdeCambodiaCameroonCanadaCaribbean small statesCayman IslandsCentral African RepublicCentral Europe and the BalticsChadChannel IslandsChileChinaColombiaComorosCongo, Dem. Rep.Congo, Rep.Costa RicaCote d'IvoireCroatiaCubaCyprusCzech RepublicDenmarkDjiboutiDominicaDominican RepublicEarly-demographic dividendEast Asia & PacificEast Asia & Pacific (excluding high income)East Asia & Pacific (IDA & IBRD countries)EcuadorEgypt, Arab Rep.El SalvadorEquatorial GuineaEritreaEstoniaEthiopiaEuro areaEurope & Central AsiaEurope & Central Asia (excluding high income)Europe & Central Asia (IDA & IBRD countries)European UnionFaroe IslandsFijiFinlandFragile and conflict affected situationsFranceFrench PolynesiaGabonGambia, TheGeorgiaGermanyGhanaGreeceGreenlandGrenadaGuatemalaGuineaGuinea-BissauGuyanaHaitiHeavily indebted poor countries (HIPC)High incomeHondurasHong Kong SAR, ChinaHungaryIBRD onlyIcelandIDA & IBRD totalIDA blendIDA onlyIDA totalIndiaIndonesiaIran, Islamic Rep.IraqIrelandIsle of ManIsraelItalyJamaicaJapanJordanKazakhstanKenyaKiribatiKorea, Rep.KosovoKuwaitKyrgyz RepublicLao PDRLate-demographic dividendLatin America & Caribbean Latin America & Caribbean (excluding high income)Latin America & the Caribbean (IDA & IBRD countries)LatviaLeast developed countries: UN classificationLebanonLesothoLiberiaLibyaLiechtensteinLithuaniaLow & middle incomeLow incomeLower middle incomeLuxembourgMacao SAR, ChinaMacedonia, FYRMadagascarMalawiMalaysiaMaldivesMaliMaltaMarshall IslandsMauritaniaMauritiusMexicoMicronesia, Fed. Sts.Middle East & North AfricaMiddle East & North Africa (excluding high income)Middle East & North Africa (IDA & IBRD countries)Middle incomeMoldovaMonacoMongoliaMontenegroMoroccoMozambiqueMyanmarNamibiaNauruNepalNetherlandsNew CaledoniaNew ZealandNicaraguaNigerNigeriaNorth AmericaNorwayOECD membersOmanOther small statesPacific island small statesPakistanPalauPanamaPapua New GuineaParaguayPeruPhilippinesPolandPortugalPost-demographic dividendPre-demographic dividendPuerto RicoQatarRomaniaRussian FederationRwandaSamoaSan MarinoSao Tome and PrincipeSaudi ArabiaSenegalSerbiaSeychellesSierra LeoneSingaporeSlovak RepublicSloveniaSmall statesSolomon IslandsSomaliaSouth AfricaSouth AsiaSouth Asia (IDA & IBRD)South SudanSpainSri LankaSt. Kitts and NevisSt. LuciaSt. Vincent and the GrenadinesSub-Saharan Africa Sub-Saharan Africa (excluding high income)Sub-Saharan Africa (IDA & IBRD countries)SudanSurinameSwazilandSwedenSwitzerlandSyrian Arab RepublicTajikistanTanzaniaThailandTimor-LesteTogoTongaTrinidad and TobagoTunisiaTurkeyTurkmenistanTuvaluUgandaUkraineUnited Arab EmiratesUnited KingdomUnited StatesUpper middle incomeUruguayUzbekistanVanuatuVenezuela, RBVietnamVirgin Islands (U.S.)West Bank and GazaWorldYemen, Rep.ZambiaZimbabwe Timeline:
This timeline shows a graph from 1961 to 2014 of Bermuda. No data until 1960. Number of actual observations by date: 54.
Source name:
World Development Indicators
Source organization:
World Bank national accounts data, and OECD National Accounts data files.
Categories, topics:
Economy & Growth
Last updated:
apr 23, 2017
Indicators value changes by year
Minimum:
1.902K
jan 1, 1961
Maximum:
93.606K
jan 1, 2009
At the date of observation
Value
Absolute change
Change from previous value
jan 1, 1961
1.902K
+1.902K
0.0%
jan 1, 1962
1.962K
+59.136
3.11%
jan 1, 1963
2.02K
+58.848
3.0%
jan 1, 1964
2.02K
-0.121
-0.01%
jan 1, 1965
2.2K
+179.462
8.88%
jan 1, 1966
2.282K
+82.49
3.75%
jan 1, 1967
2.631K
+348.634
15.28%
jan 1, 1968
2.983K
+351.899
13.38%
jan 1, 1969
2.83K
-152.561
-5.11%
jan 1, 1970
3.054K
+223.515
7.9%
jan 1, 1971
3.387K
+333.569
10.92%
jan 1, 1972
3.866K
+479.028
14.14%
jan 1, 1973
4.343K
+476.873
12.33%
jan 1, 1974
5.009K
+666.12
15.34%
jan 1, 1975
5.854K
+844.639
16.86%
jan 1, 1976
6.509K
+655.501
11.2%
jan 1, 1977
7.261K
+751.844
11.55%
jan 1, 1978
8.371K
+1.11K
15.28%
jan 1, 1979
8.877K
+506.079
6.05%
jan 1, 1980
9.613K
+736.517
8.3%
jan 1, 1981
11.218K
+1.605K
16.69%
jan 1, 1982
13.426K
+2.208K
19.68%
jan 1, 1983
14.166K
+740.194
5.51%
jan 1, 1984
15.902K
+1.736K
12.25%
jan 1, 1985
17.47K
+1.568K
9.86%
jan 1, 1986
18.27K
+799.71
4.58%
jan 1, 1987
20.451K
+2.181K
11.94%
jan 1, 1988
22.412K
+1.961K
9.59%
jan 1, 1989
24.253K
+1.841K
8.22%
jan 1, 1990
25.518K
+1.265K
5.21%
jan 1, 1991
26.842K
+1.324K
5.19%
jan 1, 1992
27.7K
+858.79
3.2%
jan 1, 1993
28.67K
+969.373
3.5%
jan 1, 1994
30.901K
+2.231K
7.78%
jan 1, 1995
31.476K
+575.368
1.86%
jan 1, 1996
33.99K
+2.514K
7.99%
jan 1, 1997
44.827K
+10.837K
31.88%
jan 1, 1998
48.479K
+3.652K
8.15%
jan 1, 1999
51.372K
+2.893K
5.97%
jan 1, 2000
54.245K
+2.874K
5.59%
jan 1, 2001
56.284K
+2.039K
3.76%
jan 1, 2002
58.884K
+2.6K
4.62%
jan 1, 2003
62.583K
+3.699K
6.28%
jan 1, 2004
66.112K
+3.529K
5.64%
jan 1, 2005
70.359K
+4.248K
6.42%
jan 1, 2006
75.882K
+5.523K
7.85%
jan 1, 2007
83.913K
+8.031K
10.58%
jan 1, 2008
90.85K
+6.937K
8.27%
jan 1, 2009
93.606K
+2.756K
3.03%
jan 1, 2010
88.463K
-5.142K
-5.49%
jan 1, 2011
88.207K
-255.985
-0.29%
jan 1, 2012
85.973K
-2.234K
-2.53%
jan 1, 2013
85.458K
-514.703
-0.6%
jan 1, 2014
85.748K
+289.61
0.34%
Ranking of countries by current statistics by years


Comments: