29
/
en
AIzaSyAYiBZKx7MnpbEhh9jyipgxe19OcubqV5w
April 1, 2024
164841
Jordan
JOR
true
2
1
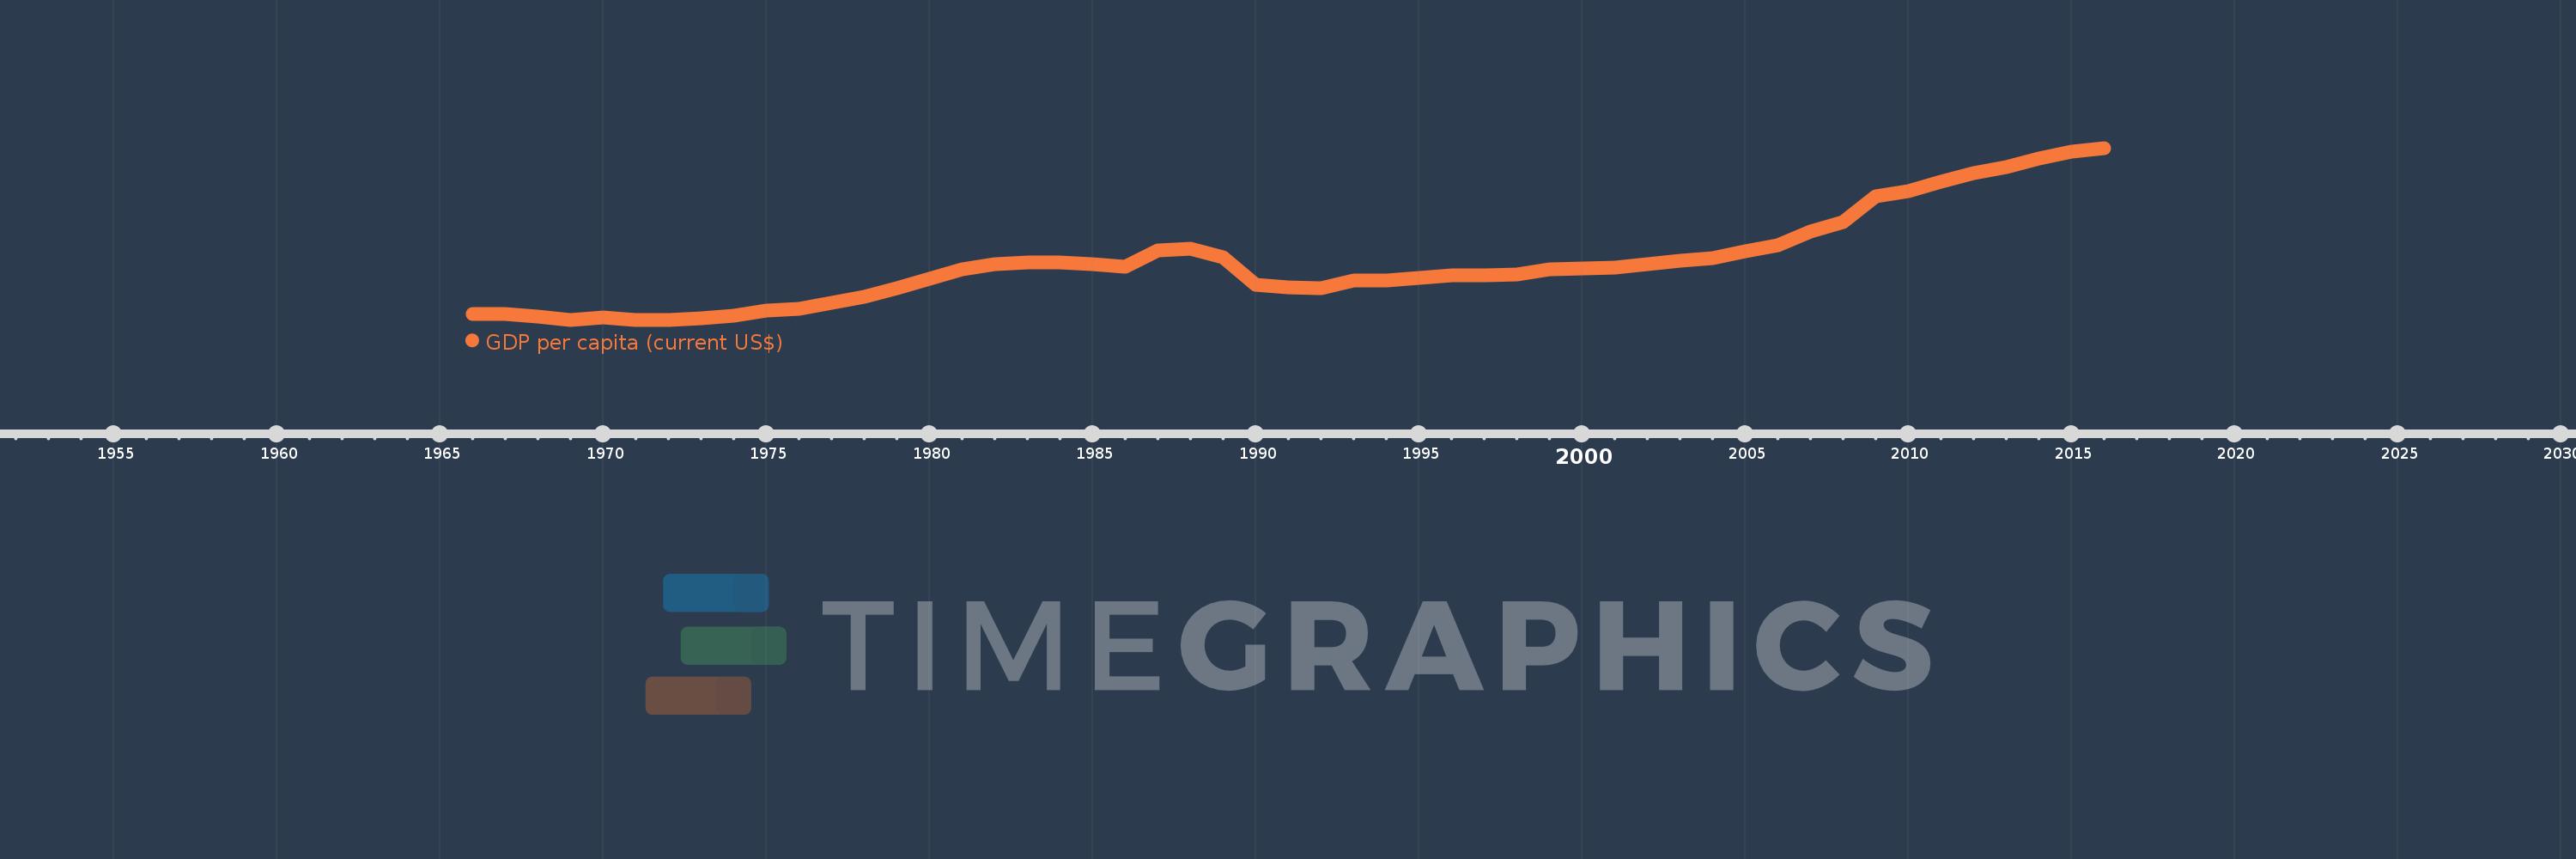
GDP per capita (current US$)
2016,2015,2014,2013,2012,2011,2010,2009,2008,2007,2006,2005,2004,2003,2002,2001,2000,1999,1998,1997,1996,1995,1994,1993,1992,1991,1990,1989,1988,1987,1986,1985,1984,1983,1982,1981,1980,1979,1978,1977,1976,1975,1974,1973,1972,1971,1970,1969,1968,1967,1966
This statistics in other country:
AfghanistanAlbaniaAlgeriaAndorraAngolaAntigua and BarbudaArab WorldArgentinaArmeniaArubaAustraliaAustriaAzerbaijanBahamas, TheBahrainBangladeshBarbadosBelarusBelgiumBelizeBeninBermudaBhutanBoliviaBosnia and HerzegovinaBotswanaBrazilBrunei DarussalamBulgariaBurkina FasoBurundiCabo VerdeCambodiaCameroonCanadaCaribbean small statesCayman IslandsCentral African RepublicCentral Europe and the BalticsChadChannel IslandsChileChinaColombiaComorosCongo, Dem. Rep.Congo, Rep.Costa RicaCote d'IvoireCroatiaCubaCyprusCzech RepublicDenmarkDjiboutiDominicaDominican RepublicEarly-demographic dividendEast Asia & PacificEast Asia & Pacific (excluding high income)East Asia & Pacific (IDA & IBRD countries)EcuadorEgypt, Arab Rep.El SalvadorEquatorial GuineaEritreaEstoniaEthiopiaEuro areaEurope & Central AsiaEurope & Central Asia (excluding high income)Europe & Central Asia (IDA & IBRD countries)European UnionFaroe IslandsFijiFinlandFragile and conflict affected situationsFranceFrench PolynesiaGabonGambia, TheGeorgiaGermanyGhanaGreeceGreenlandGrenadaGuatemalaGuineaGuinea-BissauGuyanaHaitiHeavily indebted poor countries (HIPC)High incomeHondurasHong Kong SAR, ChinaHungaryIBRD onlyIcelandIDA & IBRD totalIDA blendIDA onlyIDA totalIndiaIndonesiaIran, Islamic Rep.IraqIrelandIsle of ManIsraelItalyJamaicaJapanJordanKazakhstanKenyaKiribatiKorea, Rep.KosovoKuwaitKyrgyz RepublicLao PDRLate-demographic dividendLatin America & Caribbean Latin America & Caribbean (excluding high income)Latin America & the Caribbean (IDA & IBRD countries)LatviaLeast developed countries: UN classificationLebanonLesothoLiberiaLibyaLiechtensteinLithuaniaLow & middle incomeLow incomeLower middle incomeLuxembourgMacao SAR, ChinaMacedonia, FYRMadagascarMalawiMalaysiaMaldivesMaliMaltaMarshall IslandsMauritaniaMauritiusMexicoMicronesia, Fed. Sts.Middle East & North AfricaMiddle East & North Africa (excluding high income)Middle East & North Africa (IDA & IBRD countries)Middle incomeMoldovaMonacoMongoliaMontenegroMoroccoMozambiqueMyanmarNamibiaNauruNepalNetherlandsNew CaledoniaNew ZealandNicaraguaNigerNigeriaNorth AmericaNorwayOECD membersOmanOther small statesPacific island small statesPakistanPalauPanamaPapua New GuineaParaguayPeruPhilippinesPolandPortugalPost-demographic dividendPre-demographic dividendPuerto RicoQatarRomaniaRussian FederationRwandaSamoaSan MarinoSao Tome and PrincipeSaudi ArabiaSenegalSerbiaSeychellesSierra LeoneSingaporeSlovak RepublicSloveniaSmall statesSolomon IslandsSomaliaSouth AfricaSouth AsiaSouth Asia (IDA & IBRD)South SudanSpainSri LankaSt. Kitts and NevisSt. LuciaSt. Vincent and the GrenadinesSub-Saharan Africa Sub-Saharan Africa (excluding high income)Sub-Saharan Africa (IDA & IBRD countries)SudanSurinameSwazilandSwedenSwitzerlandSyrian Arab RepublicTajikistanTanzaniaThailandTimor-LesteTogoTongaTrinidad and TobagoTunisiaTurkeyTurkmenistanTuvaluUgandaUkraineUnited Arab EmiratesUnited KingdomUnited StatesUpper middle incomeUruguayUzbekistanVanuatuVenezuela, RBVietnamVirgin Islands (U.S.)West Bank and GazaWorldYemen, Rep.ZambiaZimbabwe Timeline:
This timeline shows a graph from 1966 to 2016 of Jordan. No data until 1965. Number of actual observations by date: 51.
Source name:
World Development Indicators
Source organization:
World Bank national accounts data, and OECD National Accounts data files.
Categories, topics:
Economy & Growth
Last updated:
apr 23, 2017
Indicators value changes by year
Minimum:
386.517
jan 1, 1971
At the date of observation
Value
Absolute change
Change from previous value
jan 1, 1966
535.661
+535.661
0.0%
jan 1, 1967
543.441
+7.78
1.45%
jan 1, 1968
478.453
-64.988
-11.96%
jan 1, 1969
389.988
-88.465
-18.49%
jan 1, 1970
449.904
+59.916
15.36%
jan 1, 1971
386.517
-63.387
-14.09%
jan 1, 1972
389.816
+3.298
0.85%
jan 1, 1973
435.227
+45.411
11.65%
jan 1, 1974
503.697
+68.47
15.73%
jan 1, 1975
620.462
+116.765
23.18%
jan 1, 1976
686.628
+66.166
10.66%
jan 1, 1977
837.979
+151.351
22.04%
jan 1, 1978
1.002K
+164.341
19.61%
jan 1, 1979
1.212K
+210.143
20.97%
jan 1, 1980
1.481K
+268.921
22.18%
jan 1, 1981
1.714K
+233.041
15.73%
jan 1, 1982
1.853K
+139.044
8.11%
jan 1, 1983
1.9K
+46.908
2.53%
jan 1, 1984
1.916K
+15.236
0.8%
jan 1, 1985
1.856K
-59.949
-3.13%
jan 1, 1986
1.794K
-61.184
-3.3%
jan 1, 1987
2.22K
+425.089
23.69%
jan 1, 1988
2.265K
+45.625
2.06%
jan 1, 1989
2.034K
-231.543
-10.22%
jan 1, 1990
1.315K
-718.496
-35.33%
jan 1, 1991
1.239K
-76.488
-5.82%
jan 1, 1992
1.228K
-11.014
-0.89%
jan 1, 1993
1.419K
+190.992
15.56%
jan 1, 1994
1.417K
-2.035
-0.14%
jan 1, 1995
1.501K
+84.718
5.98%
jan 1, 1996
1.557K
+55.894
3.72%
jan 1, 1997
1.558K
+0.373
0.02%
jan 1, 1998
1.594K
+36.246
2.33%
jan 1, 1999
1.712K
+117.922
7.4%
jan 1, 2000
1.737K
+24.923
1.46%
jan 1, 2001
1.774K
+37.402
2.15%
jan 1, 2002
1.85K
+75.97
4.28%
jan 1, 2003
1.94K
+89.715
4.85%
jan 1, 2004
2.021K
+81.687
4.21%
jan 1, 2005
2.206K
+184.335
9.12%
jan 1, 2006
2.361K
+154.734
7.01%
jan 1, 2007
2.723K
+362.136
15.34%
jan 1, 2008
2.971K
+248.223
9.12%
jan 1, 2009
3.656K
+684.969
23.06%
jan 1, 2010
3.801K
+144.818
3.96%
jan 1, 2011
4.054K
+253.595
6.67%
jan 1, 2012
4.266K
+211.806
5.22%
jan 1, 2013
4.423K
+157.04
3.68%
jan 1, 2014
4.656K
+233.102
5.27%
jan 1, 2015
4.831K
+174.757
3.75%
jan 1, 2016
4.94K
+109.069
2.26%
Ranking of countries by current statistics by years


Comments: