29
/
en
AIzaSyAYiBZKx7MnpbEhh9jyipgxe19OcubqV5w
April 1, 2024
44251
Least developed countries: UN classification
LDC
false
2
1
GDP per capita (current US$)
2016,2015,2014,2013,2012,2011,2010,2009,2008,2007,2006,2005,2004,2003,2002,2001,2000,1999,1998,1997,1996,1995,1994,1993,1992,1991,1990,1989,1988,1987,1986
This statistics in other country:
AfghanistanAlbaniaAlgeriaAndorraAngolaAntigua and BarbudaArab WorldArgentinaArmeniaArubaAustraliaAustriaAzerbaijanBahamas, TheBahrainBangladeshBarbadosBelarusBelgiumBelizeBeninBermudaBhutanBoliviaBosnia and HerzegovinaBotswanaBrazilBrunei DarussalamBulgariaBurkina FasoBurundiCabo VerdeCambodiaCameroonCanadaCaribbean small statesCayman IslandsCentral African RepublicCentral Europe and the BalticsChadChannel IslandsChileChinaColombiaComorosCongo, Dem. Rep.Congo, Rep.Costa RicaCote d'IvoireCroatiaCubaCyprusCzech RepublicDenmarkDjiboutiDominicaDominican RepublicEarly-demographic dividendEast Asia & PacificEast Asia & Pacific (excluding high income)East Asia & Pacific (IDA & IBRD countries)EcuadorEgypt, Arab Rep.El SalvadorEquatorial GuineaEritreaEstoniaEthiopiaEuro areaEurope & Central AsiaEurope & Central Asia (excluding high income)Europe & Central Asia (IDA & IBRD countries)European UnionFaroe IslandsFijiFinlandFragile and conflict affected situationsFranceFrench PolynesiaGabonGambia, TheGeorgiaGermanyGhanaGreeceGreenlandGrenadaGuatemalaGuineaGuinea-BissauGuyanaHaitiHeavily indebted poor countries (HIPC)High incomeHondurasHong Kong SAR, ChinaHungaryIBRD onlyIcelandIDA & IBRD totalIDA blendIDA onlyIDA totalIndiaIndonesiaIran, Islamic Rep.IraqIrelandIsle of ManIsraelItalyJamaicaJapanJordanKazakhstanKenyaKiribatiKorea, Rep.KosovoKuwaitKyrgyz RepublicLao PDRLate-demographic dividendLatin America & Caribbean Latin America & Caribbean (excluding high income)Latin America & the Caribbean (IDA & IBRD countries)LatviaLeast developed countries: UN classificationLebanonLesothoLiberiaLibyaLiechtensteinLithuaniaLow & middle incomeLow incomeLower middle incomeLuxembourgMacao SAR, ChinaMacedonia, FYRMadagascarMalawiMalaysiaMaldivesMaliMaltaMarshall IslandsMauritaniaMauritiusMexicoMicronesia, Fed. Sts.Middle East & North AfricaMiddle East & North Africa (excluding high income)Middle East & North Africa (IDA & IBRD countries)Middle incomeMoldovaMonacoMongoliaMontenegroMoroccoMozambiqueMyanmarNamibiaNauruNepalNetherlandsNew CaledoniaNew ZealandNicaraguaNigerNigeriaNorth AmericaNorwayOECD membersOmanOther small statesPacific island small statesPakistanPalauPanamaPapua New GuineaParaguayPeruPhilippinesPolandPortugalPost-demographic dividendPre-demographic dividendPuerto RicoQatarRomaniaRussian FederationRwandaSamoaSan MarinoSao Tome and PrincipeSaudi ArabiaSenegalSerbiaSeychellesSierra LeoneSingaporeSlovak RepublicSloveniaSmall statesSolomon IslandsSomaliaSouth AfricaSouth AsiaSouth Asia (IDA & IBRD)South SudanSpainSri LankaSt. Kitts and NevisSt. LuciaSt. Vincent and the GrenadinesSub-Saharan Africa Sub-Saharan Africa (excluding high income)Sub-Saharan Africa (IDA & IBRD countries)SudanSurinameSwazilandSwedenSwitzerlandSyrian Arab RepublicTajikistanTanzaniaThailandTimor-LesteTogoTongaTrinidad and TobagoTunisiaTurkeyTurkmenistanTuvaluUgandaUkraineUnited Arab EmiratesUnited KingdomUnited StatesUpper middle incomeUruguayUzbekistanVanuatuVenezuela, RBVietnamVirgin Islands (U.S.)West Bank and GazaWorldYemen, Rep.ZambiaZimbabwe Timeline:
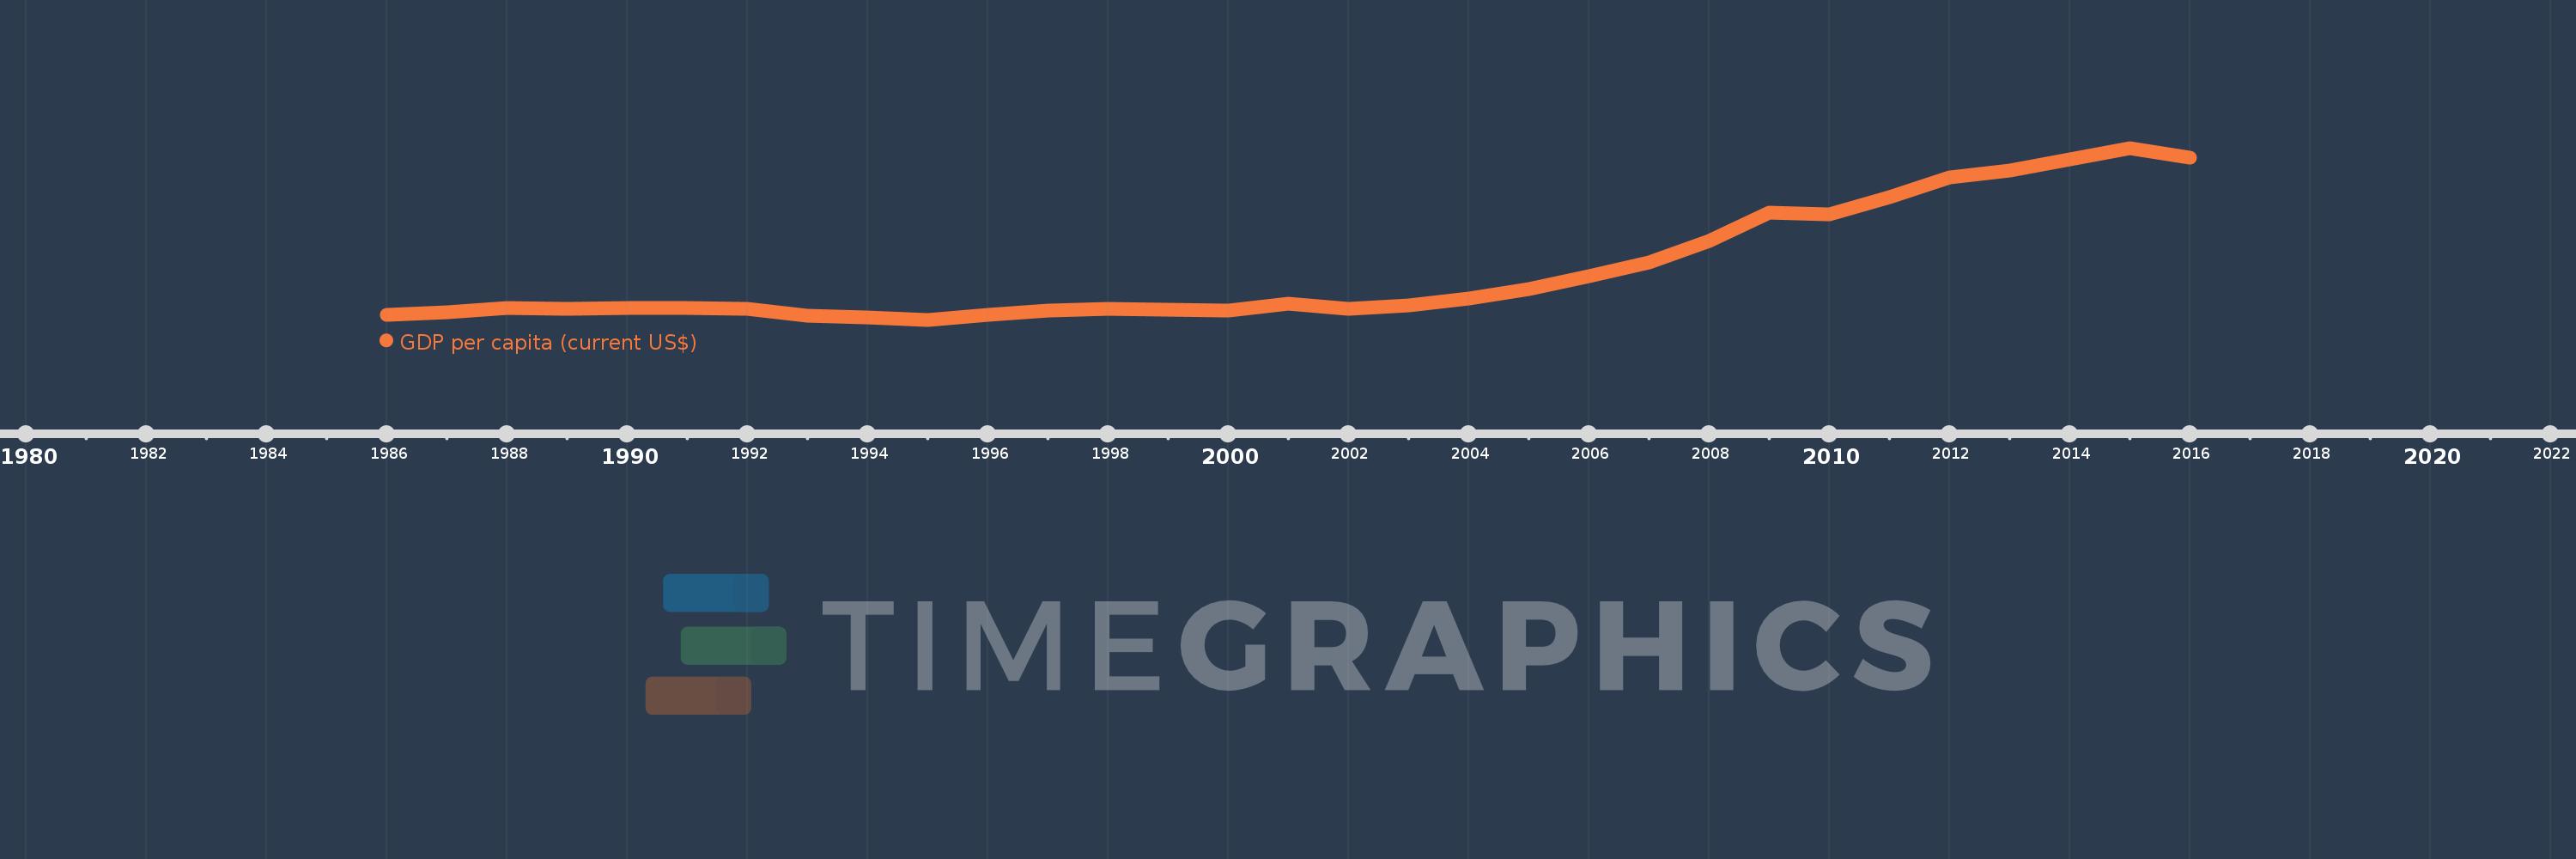
This timeline shows a graph from 1986 to 2016 of Least developed countries: UN classification. No data until 1985. Number of actual observations by date: 31.
Source name:
World Development Indicators
Source organization:
World Bank national accounts data, and OECD National Accounts data files.
Categories, topics:
Economy & Growth
Last updated:
apr 23, 2017
Indicators value changes by year
Minimum:
239.339
jan 1, 1995
Maximum:
1.024K
jan 1, 2015
At the date of observation
Value
Absolute change
Change from previous value
jan 1, 1986
259.785
+259.785
0.0%
jan 1, 1987
274.699
+14.914
5.74%
jan 1, 1988
294.379
+19.68
7.16%
jan 1, 1989
290.959
-3.42
-1.16%
jan 1, 1990
294.341
+3.382
1.16%
jan 1, 1991
294.871
+0.529
0.18%
jan 1, 1992
290.463
-4.408
-1.49%
jan 1, 1993
259.688
-30.775
-10.6%
jan 1, 1994
251.87
-7.818
-3.01%
jan 1, 1995
239.339
-12.531
-4.98%
jan 1, 1996
260.585
+21.246
8.88%
jan 1, 1997
280.889
+20.303
7.79%
jan 1, 1998
290.145
+9.256
3.3%
jan 1, 1999
284.388
-5.757
-1.98%
jan 1, 2000
280.998
-3.39
-1.19%
jan 1, 2001
311.474
+30.475
10.85%
jan 1, 2002
289.789
-21.685
-6.96%
jan 1, 2003
305.375
+15.586
5.38%
jan 1, 2004
337.578
+32.203
10.55%
jan 1, 2005
380.571
+42.993
12.74%
jan 1, 2006
438.866
+58.295
15.32%
jan 1, 2007
501.868
+63.002
14.36%
jan 1, 2008
597.698
+95.83
19.09%
jan 1, 2009
730.426
+132.728
22.21%
jan 1, 2010
719.722
-10.704
-1.47%
jan 1, 2011
797.935
+78.213
10.87%
jan 1, 2012
889.063
+91.128
11.42%
jan 1, 2013
921.118
+32.056
3.61%
jan 1, 2014
972.055
+50.936
5.53%
jan 1, 2015
1.024K
+52.321
5.38%
jan 1, 2016
978.846
-45.53
-4.44%
Ranking of countries by current statistics by years


Comments: