29
/
en
AIzaSyAYiBZKx7MnpbEhh9jyipgxe19OcubqV5w
April 1, 2024
255175
Swaziland
SWZ
true
2
1
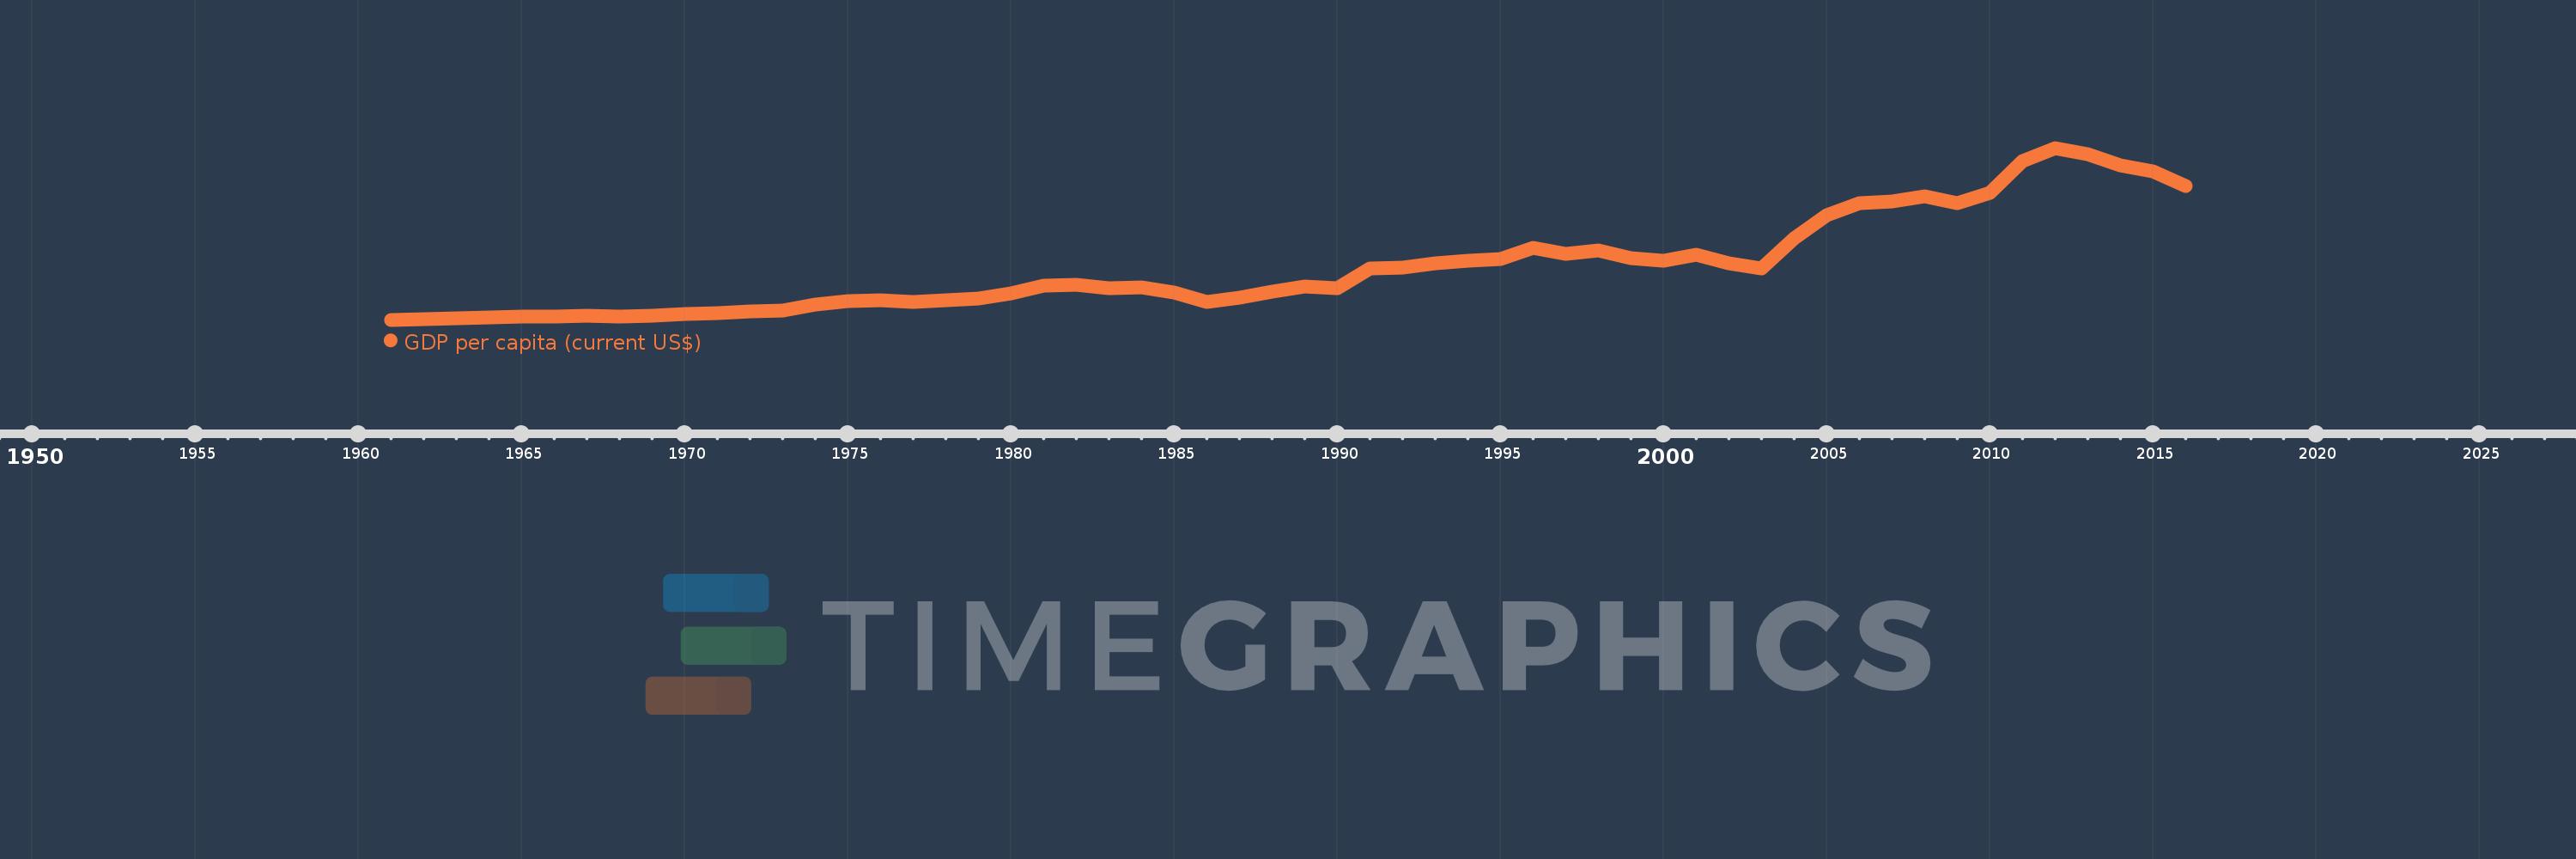
GDP per capita (current US$)
2016,2015,2014,2013,2012,2011,2010,2009,2008,2007,2006,2005,2004,2003,2002,2001,2000,1999,1998,1997,1996,1995,1994,1993,1992,1991,1990,1989,1988,1987,1986,1985,1984,1983,1982,1981,1980,1979,1978,1977,1976,1975,1974,1973,1972,1971,1970,1969,1968,1967,1966,1965,1964,1963,1962,1961
This statistics in other country:
AfghanistanAlbaniaAlgeriaAndorraAngolaAntigua and BarbudaArab WorldArgentinaArmeniaArubaAustraliaAustriaAzerbaijanBahamas, TheBahrainBangladeshBarbadosBelarusBelgiumBelizeBeninBermudaBhutanBoliviaBosnia and HerzegovinaBotswanaBrazilBrunei DarussalamBulgariaBurkina FasoBurundiCabo VerdeCambodiaCameroonCanadaCaribbean small statesCayman IslandsCentral African RepublicCentral Europe and the BalticsChadChannel IslandsChileChinaColombiaComorosCongo, Dem. Rep.Congo, Rep.Costa RicaCote d'IvoireCroatiaCubaCyprusCzech RepublicDenmarkDjiboutiDominicaDominican RepublicEarly-demographic dividendEast Asia & PacificEast Asia & Pacific (excluding high income)East Asia & Pacific (IDA & IBRD countries)EcuadorEgypt, Arab Rep.El SalvadorEquatorial GuineaEritreaEstoniaEthiopiaEuro areaEurope & Central AsiaEurope & Central Asia (excluding high income)Europe & Central Asia (IDA & IBRD countries)European UnionFaroe IslandsFijiFinlandFragile and conflict affected situationsFranceFrench PolynesiaGabonGambia, TheGeorgiaGermanyGhanaGreeceGreenlandGrenadaGuatemalaGuineaGuinea-BissauGuyanaHaitiHeavily indebted poor countries (HIPC)High incomeHondurasHong Kong SAR, ChinaHungaryIBRD onlyIcelandIDA & IBRD totalIDA blendIDA onlyIDA totalIndiaIndonesiaIran, Islamic Rep.IraqIrelandIsle of ManIsraelItalyJamaicaJapanJordanKazakhstanKenyaKiribatiKorea, Rep.KosovoKuwaitKyrgyz RepublicLao PDRLate-demographic dividendLatin America & Caribbean Latin America & Caribbean (excluding high income)Latin America & the Caribbean (IDA & IBRD countries)LatviaLeast developed countries: UN classificationLebanonLesothoLiberiaLibyaLiechtensteinLithuaniaLow & middle incomeLow incomeLower middle incomeLuxembourgMacao SAR, ChinaMacedonia, FYRMadagascarMalawiMalaysiaMaldivesMaliMaltaMarshall IslandsMauritaniaMauritiusMexicoMicronesia, Fed. Sts.Middle East & North AfricaMiddle East & North Africa (excluding high income)Middle East & North Africa (IDA & IBRD countries)Middle incomeMoldovaMonacoMongoliaMontenegroMoroccoMozambiqueMyanmarNamibiaNauruNepalNetherlandsNew CaledoniaNew ZealandNicaraguaNigerNigeriaNorth AmericaNorwayOECD membersOmanOther small statesPacific island small statesPakistanPalauPanamaPapua New GuineaParaguayPeruPhilippinesPolandPortugalPost-demographic dividendPre-demographic dividendPuerto RicoQatarRomaniaRussian FederationRwandaSamoaSan MarinoSao Tome and PrincipeSaudi ArabiaSenegalSerbiaSeychellesSierra LeoneSingaporeSlovak RepublicSloveniaSmall statesSolomon IslandsSomaliaSouth AfricaSouth AsiaSouth Asia (IDA & IBRD)South SudanSpainSri LankaSt. Kitts and NevisSt. LuciaSt. Vincent and the GrenadinesSub-Saharan Africa Sub-Saharan Africa (excluding high income)Sub-Saharan Africa (IDA & IBRD countries)SudanSurinameSwazilandSwedenSwitzerlandSyrian Arab RepublicTajikistanTanzaniaThailandTimor-LesteTogoTongaTrinidad and TobagoTunisiaTurkeyTurkmenistanTuvaluUgandaUkraineUnited Arab EmiratesUnited KingdomUnited StatesUpper middle incomeUruguayUzbekistanVanuatuVenezuela, RBVietnamVirgin Islands (U.S.)West Bank and GazaWorldYemen, Rep.ZambiaZimbabwe Timeline:
This timeline shows a graph from 1961 to 2016 of Swaziland. No data until 1960. Number of actual observations by date: 56.
Source name:
World Development Indicators
Source organization:
World Bank national accounts data, and OECD National Accounts data files.
Categories, topics:
Economy & Growth
Last updated:
apr 23, 2017
Indicators value changes by year
Minimum:
100.438
jan 1, 1961
Maximum:
4.091K
jan 1, 2012
At the date of observation
Value
Absolute change
Change from previous value
jan 1, 1961
100.438
+100.438
0.0%
jan 1, 1962
120.343
+19.905
19.82%
jan 1, 1963
125.58
+5.237
4.35%
jan 1, 1964
144.732
+19.152
15.25%
jan 1, 1965
169.847
+25.115
17.35%
jan 1, 1966
179.438
+9.591
5.65%
jan 1, 1967
191.526
+12.088
6.74%
jan 1, 1968
181.683
-9.843
-5.14%
jan 1, 1969
188.977
+7.294
4.01%
jan 1, 1970
243.061
+54.085
28.62%
jan 1, 1971
251.518
+8.457
3.48%
jan 1, 1972
297.493
+45.976
18.28%
jan 1, 1973
310.671
+13.177
4.43%
jan 1, 1974
455.973
+145.302
46.77%
jan 1, 1975
526.942
+70.969
15.56%
jan 1, 1976
557.538
+30.596
5.81%
jan 1, 1977
511.077
-46.461
-8.33%
jan 1, 1978
552.679
+41.601
8.14%
jan 1, 1979
600.142
+47.463
8.59%
jan 1, 1980
704.03
+103.888
17.31%
jan 1, 1981
898.284
+194.255
27.59%
jan 1, 1982
919.893
+21.609
2.41%
jan 1, 1983
840.839
-79.055
-8.59%
jan 1, 1984
843.34
+2.501
0.3%
jan 1, 1985
726.9
-116.44
-13.81%
jan 1, 1986
511.721
-215.179
-29.6%
jan 1, 1987
611.258
+99.538
19.45%
jan 1, 1988
761.171
+149.913
24.53%
jan 1, 1989
863.564
+102.393
13.45%
jan 1, 1990
835.843
-27.72
-3.21%
jan 1, 1991
1.292K
+456.224
54.58%
jan 1, 1992
1.303K
+10.997
0.85%
jan 1, 1993
1.415K
+111.958
8.59%
jan 1, 1994
1.465K
+50.288
3.55%
jan 1, 1995
1.503K
+37.822
2.58%
jan 1, 1996
1.763K
+260.343
17.32%
jan 1, 1997
1.628K
-135.492
-7.68%
jan 1, 1998
1.705K
+77.189
4.74%
jan 1, 1999
1.533K
-172.254
-10.1%
jan 1, 2000
1.477K
-56.143
-3.66%
jan 1, 2001
1.603K
+126.156
8.54%
jan 1, 2002
1.418K
-184.582
-11.52%
jan 1, 2003
1.3K
-118.629
-8.36%
jan 1, 2004
1.995K
+695.37
53.5%
jan 1, 2005
2.523K
+527.769
26.45%
jan 1, 2006
2.813K
+289.729
11.48%
jan 1, 2007
2.844K
+31.283
1.11%
jan 1, 2008
2.963K
+119.017
4.19%
jan 1, 2009
2.809K
-154.138
-5.2%
jan 1, 2010
3.047K
+237.876
8.47%
jan 1, 2011
3.794K
+747.033
24.52%
jan 1, 2012
4.091K
+297.198
7.83%
jan 1, 2013
3.953K
-138.201
-3.38%
jan 1, 2014
3.687K
-265.777
-6.72%
jan 1, 2015
3.54K
-146.961
-3.99%
jan 1, 2016
3.2K
-339.775
-9.6%
Ranking of countries by current statistics by years


Comments: