29
/
en
AIzaSyAYiBZKx7MnpbEhh9jyipgxe19OcubqV5w
April 1, 2024
144371
Guatemala
GTM
true
2
1
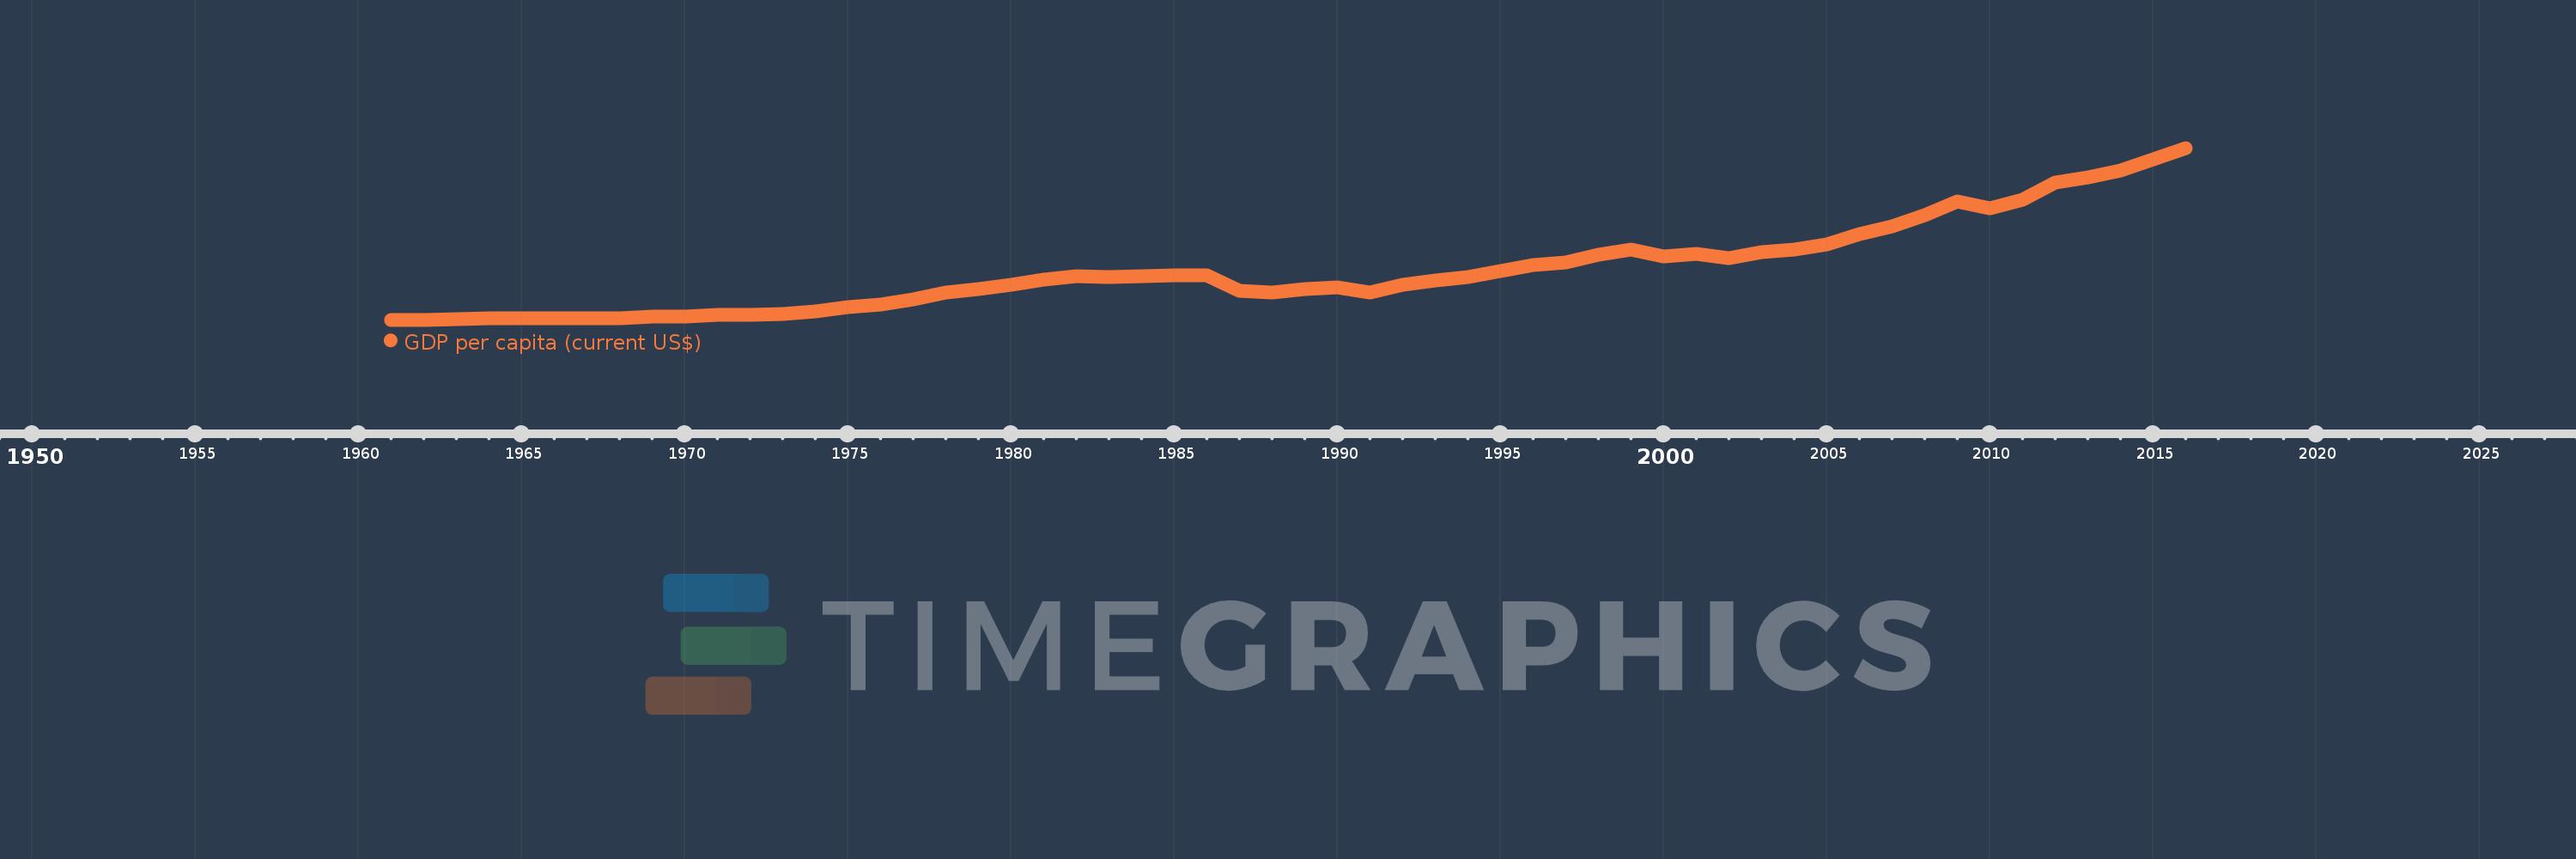
GDP per capita (current US$)
2016,2015,2014,2013,2012,2011,2010,2009,2008,2007,2006,2005,2004,2003,2002,2001,2000,1999,1998,1997,1996,1995,1994,1993,1992,1991,1990,1989,1988,1987,1986,1985,1984,1983,1982,1981,1980,1979,1978,1977,1976,1975,1974,1973,1972,1971,1970,1969,1968,1967,1966,1965,1964,1963,1962,1961
This statistics in other country:
AfghanistanAlbaniaAlgeriaAndorraAngolaAntigua and BarbudaArab WorldArgentinaArmeniaArubaAustraliaAustriaAzerbaijanBahamas, TheBahrainBangladeshBarbadosBelarusBelgiumBelizeBeninBermudaBhutanBoliviaBosnia and HerzegovinaBotswanaBrazilBrunei DarussalamBulgariaBurkina FasoBurundiCabo VerdeCambodiaCameroonCanadaCaribbean small statesCayman IslandsCentral African RepublicCentral Europe and the BalticsChadChannel IslandsChileChinaColombiaComorosCongo, Dem. Rep.Congo, Rep.Costa RicaCote d'IvoireCroatiaCubaCyprusCzech RepublicDenmarkDjiboutiDominicaDominican RepublicEarly-demographic dividendEast Asia & PacificEast Asia & Pacific (excluding high income)East Asia & Pacific (IDA & IBRD countries)EcuadorEgypt, Arab Rep.El SalvadorEquatorial GuineaEritreaEstoniaEthiopiaEuro areaEurope & Central AsiaEurope & Central Asia (excluding high income)Europe & Central Asia (IDA & IBRD countries)European UnionFaroe IslandsFijiFinlandFragile and conflict affected situationsFranceFrench PolynesiaGabonGambia, TheGeorgiaGermanyGhanaGreeceGreenlandGrenadaGuatemalaGuineaGuinea-BissauGuyanaHaitiHeavily indebted poor countries (HIPC)High incomeHondurasHong Kong SAR, ChinaHungaryIBRD onlyIcelandIDA & IBRD totalIDA blendIDA onlyIDA totalIndiaIndonesiaIran, Islamic Rep.IraqIrelandIsle of ManIsraelItalyJamaicaJapanJordanKazakhstanKenyaKiribatiKorea, Rep.KosovoKuwaitKyrgyz RepublicLao PDRLate-demographic dividendLatin America & Caribbean Latin America & Caribbean (excluding high income)Latin America & the Caribbean (IDA & IBRD countries)LatviaLeast developed countries: UN classificationLebanonLesothoLiberiaLibyaLiechtensteinLithuaniaLow & middle incomeLow incomeLower middle incomeLuxembourgMacao SAR, ChinaMacedonia, FYRMadagascarMalawiMalaysiaMaldivesMaliMaltaMarshall IslandsMauritaniaMauritiusMexicoMicronesia, Fed. Sts.Middle East & North AfricaMiddle East & North Africa (excluding high income)Middle East & North Africa (IDA & IBRD countries)Middle incomeMoldovaMonacoMongoliaMontenegroMoroccoMozambiqueMyanmarNamibiaNauruNepalNetherlandsNew CaledoniaNew ZealandNicaraguaNigerNigeriaNorth AmericaNorwayOECD membersOmanOther small statesPacific island small statesPakistanPalauPanamaPapua New GuineaParaguayPeruPhilippinesPolandPortugalPost-demographic dividendPre-demographic dividendPuerto RicoQatarRomaniaRussian FederationRwandaSamoaSan MarinoSao Tome and PrincipeSaudi ArabiaSenegalSerbiaSeychellesSierra LeoneSingaporeSlovak RepublicSloveniaSmall statesSolomon IslandsSomaliaSouth AfricaSouth AsiaSouth Asia (IDA & IBRD)South SudanSpainSri LankaSt. Kitts and NevisSt. LuciaSt. Vincent and the GrenadinesSub-Saharan Africa Sub-Saharan Africa (excluding high income)Sub-Saharan Africa (IDA & IBRD countries)SudanSurinameSwazilandSwedenSwitzerlandSyrian Arab RepublicTajikistanTanzaniaThailandTimor-LesteTogoTongaTrinidad and TobagoTunisiaTurkeyTurkmenistanTuvaluUgandaUkraineUnited Arab EmiratesUnited KingdomUnited StatesUpper middle incomeUruguayUzbekistanVanuatuVenezuela, RBVietnamVirgin Islands (U.S.)West Bank and GazaWorldYemen, Rep.ZambiaZimbabwe Timeline:
This timeline shows a graph from 1961 to 2016 of Guatemala. No data until 1960. Number of actual observations by date: 56.
Source name:
World Development Indicators
Source organization:
World Bank national accounts data, and OECD National Accounts data files.
Categories, topics:
Economy & Growth
Last updated:
apr 23, 2017
Indicators value changes by year
Minimum:
252.837
jan 1, 1961
Maximum:
3.903K
jan 1, 2016
At the date of observation
Value
Absolute change
Change from previous value
jan 1, 1961
252.837
+252.837
0.0%
jan 1, 1962
253.934
+1.096
0.43%
jan 1, 1963
262.5
+8.566
3.37%
jan 1, 1964
282.069
+19.569
7.45%
jan 1, 1965
282.361
+0.292
0.1%
jan 1, 1966
281.587
-0.774
-0.27%
jan 1, 1967
286.218
+4.631
1.64%
jan 1, 1968
291.101
+4.883
1.71%
jan 1, 1969
313.848
+22.747
7.81%
jan 1, 1970
325.211
+11.363
3.62%
jan 1, 1971
351.072
+25.861
7.95%
jan 1, 1972
355.838
+4.765
1.36%
jan 1, 1973
366.226
+10.388
2.92%
jan 1, 1974
435.312
+69.086
18.86%
jan 1, 1975
520.919
+85.608
19.67%
jan 1, 1976
584.47
+63.55
12.2%
jan 1, 1977
681.224
+96.754
16.55%
jan 1, 1978
832.939
+151.716
22.27%
jan 1, 1979
898.781
+65.842
7.9%
jan 1, 1980
995.545
+96.763
10.77%
jan 1, 1981
1.107K
+111.228
11.17%
jan 1, 1982
1.177K
+70.66
6.38%
jan 1, 1983
1.161K
-16.429
-1.4%
jan 1, 1984
1.174K
+12.775
1.1%
jan 1, 1985
1.197K
+22.863
1.95%
jan 1, 1986
1.198K
+0.975
0.08%
jan 1, 1987
869.174
-328.442
-27.42%
jan 1, 1988
831.133
-38.041
-4.38%
jan 1, 1989
898.297
+67.164
8.08%
jan 1, 1990
940.767
+42.47
4.73%
jan 1, 1991
835.299
-105.468
-11.21%
jan 1, 1992
1.002K
+166.949
19.99%
jan 1, 1993
1.085K
+83.179
8.3%
jan 1, 1994
1.156K
+70.747
6.52%
jan 1, 1995
1.285K
+128.473
11.11%
jan 1, 1996
1.415K
+130.337
10.15%
jan 1, 1997
1.477K
+62.062
4.39%
jan 1, 1998
1.636K
+159.309
10.79%
jan 1, 1999
1.742K
+105.208
6.43%
jan 1, 2000
1.606K
-135.917
-7.8%
jan 1, 2001
1.65K
+44.58
2.78%
jan 1, 2002
1.562K
-88.628
-5.37%
jan 1, 2003
1.693K
+131.386
8.41%
jan 1, 2004
1.743K
+50.195
2.96%
jan 1, 2005
1.861K
+117.812
6.76%
jan 1, 2006
2.064K
+203.058
10.91%
jan 1, 2007
2.241K
+176.949
8.57%
jan 1, 2008
2.472K
+231.392
10.33%
jan 1, 2009
2.774K
+301.98
12.21%
jan 1, 2010
2.617K
-157.24
-5.67%
jan 1, 2011
2.806K
+188.845
7.22%
jan 1, 2012
3.167K
+360.603
12.85%
jan 1, 2013
3.279K
+112.049
3.54%
jan 1, 2014
3.432K
+153.391
4.68%
jan 1, 2015
3.667K
+234.562
6.83%
jan 1, 2016
3.903K
+236.899
6.46%
Ranking of countries by current statistics by years


Comments: