29
/
en
AIzaSyAYiBZKx7MnpbEhh9jyipgxe19OcubqV5w
April 1, 2024
38155
IDA blend
IDB
false
2
1
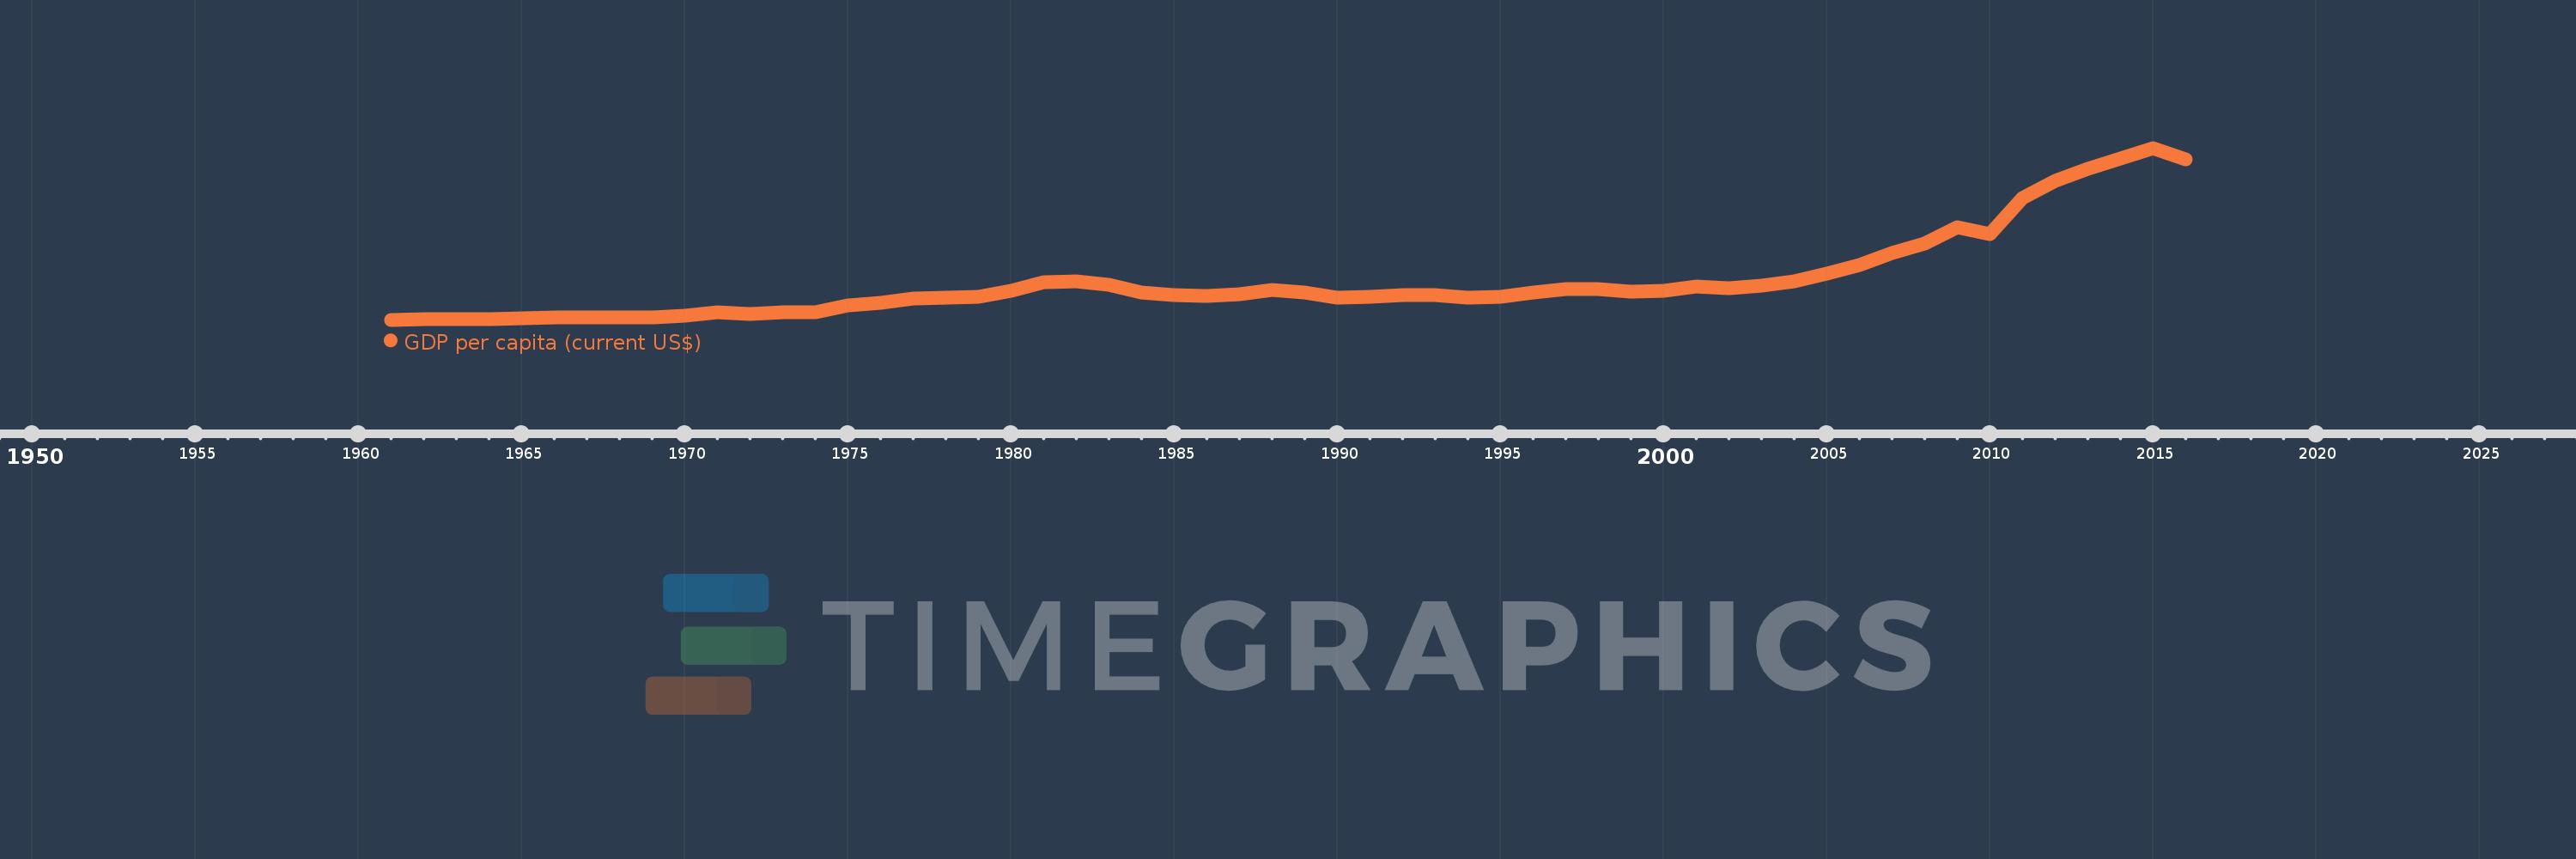
GDP per capita (current US$)
2016,2015,2014,2013,2012,2011,2010,2009,2008,2007,2006,2005,2004,2003,2002,2001,2000,1999,1998,1997,1996,1995,1994,1993,1992,1991,1990,1989,1988,1987,1986,1985,1984,1983,1982,1981,1980,1979,1978,1977,1976,1975,1974,1973,1972,1971,1970,1969,1968,1967,1966,1965,1964,1963,1962,1961
This statistics in other country:
AfghanistanAlbaniaAlgeriaAndorraAngolaAntigua and BarbudaArab WorldArgentinaArmeniaArubaAustraliaAustriaAzerbaijanBahamas, TheBahrainBangladeshBarbadosBelarusBelgiumBelizeBeninBermudaBhutanBoliviaBosnia and HerzegovinaBotswanaBrazilBrunei DarussalamBulgariaBurkina FasoBurundiCabo VerdeCambodiaCameroonCanadaCaribbean small statesCayman IslandsCentral African RepublicCentral Europe and the BalticsChadChannel IslandsChileChinaColombiaComorosCongo, Dem. Rep.Congo, Rep.Costa RicaCote d'IvoireCroatiaCubaCyprusCzech RepublicDenmarkDjiboutiDominicaDominican RepublicEarly-demographic dividendEast Asia & PacificEast Asia & Pacific (excluding high income)East Asia & Pacific (IDA & IBRD countries)EcuadorEgypt, Arab Rep.El SalvadorEquatorial GuineaEritreaEstoniaEthiopiaEuro areaEurope & Central AsiaEurope & Central Asia (excluding high income)Europe & Central Asia (IDA & IBRD countries)European UnionFaroe IslandsFijiFinlandFragile and conflict affected situationsFranceFrench PolynesiaGabonGambia, TheGeorgiaGermanyGhanaGreeceGreenlandGrenadaGuatemalaGuineaGuinea-BissauGuyanaHaitiHeavily indebted poor countries (HIPC)High incomeHondurasHong Kong SAR, ChinaHungaryIBRD onlyIcelandIDA & IBRD totalIDA blendIDA onlyIDA totalIndiaIndonesiaIran, Islamic Rep.IraqIrelandIsle of ManIsraelItalyJamaicaJapanJordanKazakhstanKenyaKiribatiKorea, Rep.KosovoKuwaitKyrgyz RepublicLao PDRLate-demographic dividendLatin America & Caribbean Latin America & Caribbean (excluding high income)Latin America & the Caribbean (IDA & IBRD countries)LatviaLeast developed countries: UN classificationLebanonLesothoLiberiaLibyaLiechtensteinLithuaniaLow & middle incomeLow incomeLower middle incomeLuxembourgMacao SAR, ChinaMacedonia, FYRMadagascarMalawiMalaysiaMaldivesMaliMaltaMarshall IslandsMauritaniaMauritiusMexicoMicronesia, Fed. Sts.Middle East & North AfricaMiddle East & North Africa (excluding high income)Middle East & North Africa (IDA & IBRD countries)Middle incomeMoldovaMonacoMongoliaMontenegroMoroccoMozambiqueMyanmarNamibiaNauruNepalNetherlandsNew CaledoniaNew ZealandNicaraguaNigerNigeriaNorth AmericaNorwayOECD membersOmanOther small statesPacific island small statesPakistanPalauPanamaPapua New GuineaParaguayPeruPhilippinesPolandPortugalPost-demographic dividendPre-demographic dividendPuerto RicoQatarRomaniaRussian FederationRwandaSamoaSan MarinoSao Tome and PrincipeSaudi ArabiaSenegalSerbiaSeychellesSierra LeoneSingaporeSlovak RepublicSloveniaSmall statesSolomon IslandsSomaliaSouth AfricaSouth AsiaSouth Asia (IDA & IBRD)South SudanSpainSri LankaSt. Kitts and NevisSt. LuciaSt. Vincent and the GrenadinesSub-Saharan Africa Sub-Saharan Africa (excluding high income)Sub-Saharan Africa (IDA & IBRD countries)SudanSurinameSwazilandSwedenSwitzerlandSyrian Arab RepublicTajikistanTanzaniaThailandTimor-LesteTogoTongaTrinidad and TobagoTunisiaTurkeyTurkmenistanTuvaluUgandaUkraineUnited Arab EmiratesUnited KingdomUnited StatesUpper middle incomeUruguayUzbekistanVanuatuVenezuela, RBVietnamVirgin Islands (U.S.)West Bank and GazaWorldYemen, Rep.ZambiaZimbabwe Timeline:
This timeline shows a graph from 1961 to 2016 of IDA blend. No data until 1960. Number of actual observations by date: 56.
Source name:
World Development Indicators
Source organization:
World Bank national accounts data, and OECD National Accounts data files.
Categories, topics:
Economy & Growth
Last updated:
apr 23, 2017
Indicators value changes by year
Minimum:
96.464
jan 1, 1961
Maximum:
2.228K
jan 1, 2015
At the date of observation
Value
Absolute change
Change from previous value
jan 1, 1961
96.464
+96.464
0.0%
jan 1, 1962
100.827
+4.362
4.52%
jan 1, 1963
104.459
+3.632
3.6%
jan 1, 1964
106.0
+1.541
1.47%
jan 1, 1965
113.124
+7.124
6.72%
jan 1, 1966
123.057
+9.933
8.78%
jan 1, 1967
129.286
+6.229
5.06%
jan 1, 1968
127.856
-1.43
-1.11%
jan 1, 1969
129.561
+1.705
1.33%
jan 1, 1970
143.785
+14.224
10.98%
jan 1, 1971
191.067
+47.282
32.88%
jan 1, 1972
173.03
-18.037
-9.44%
jan 1, 1973
187.553
+14.523
8.39%
jan 1, 1974
193.333
+5.78
3.08%
jan 1, 1975
275.538
+82.205
42.52%
jan 1, 1976
307.753
+32.215
11.69%
jan 1, 1977
360.407
+52.654
17.11%
jan 1, 1978
366.909
+6.502
1.8%
jan 1, 1979
376.93
+10.021
2.73%
jan 1, 1980
451.748
+74.818
19.85%
jan 1, 1981
562.137
+110.389
24.44%
jan 1, 1982
574.195
+12.058
2.15%
jan 1, 1983
529.717
-44.478
-7.75%
jan 1, 1984
435.407
-94.31
-17.8%
jan 1, 1985
405.375
-30.032
-6.9%
jan 1, 1986
390.979
-14.395
-3.55%
jan 1, 1987
407.884
+16.905
4.32%
jan 1, 1988
463.594
+55.71
13.66%
jan 1, 1989
436.53
-27.064
-5.84%
jan 1, 1990
370.337
-66.193
-15.16%
jan 1, 1991
385.411
+15.074
4.07%
jan 1, 1992
400.443
+15.032
3.9%
jan 1, 1993
398.291
-2.151
-0.54%
jan 1, 1994
375.029
-23.263
-5.84%
jan 1, 1995
376.792
+1.763
0.47%
jan 1, 1996
435.98
+59.188
15.71%
jan 1, 1997
472.899
+36.919
8.47%
jan 1, 1998
473.799
+0.9
0.19%
jan 1, 1999
449.09
-24.709
-5.22%
jan 1, 2000
460.976
+11.886
2.65%
jan 1, 2001
506.93
+45.954
9.97%
jan 1, 2002
484.897
-22.034
-4.35%
jan 1, 2003
515.201
+30.305
6.25%
jan 1, 2004
573.283
+58.082
11.27%
jan 1, 2005
671.2
+97.917
17.08%
jan 1, 2006
773.851
+102.651
15.29%
jan 1, 2007
930.078
+156.227
20.19%
jan 1, 2008
1.041K
+111.105
11.95%
jan 1, 2009
1.239K
+198.1
19.03%
jan 1, 2010
1.162K
-77.59
-6.26%
jan 1, 2011
1.611K
+448.972
38.65%
jan 1, 2012
1.823K
+212.79
13.21%
jan 1, 2013
1.964K
+140.743
7.72%
jan 1, 2014
2.098K
+133.595
6.8%
jan 1, 2015
2.228K
+130.688
6.23%
jan 1, 2016
2.083K
-145.161
-6.51%
Ranking of countries by current statistics by years


Comments: