29
/
en
AIzaSyAYiBZKx7MnpbEhh9jyipgxe19OcubqV5w
April 1, 2024
216425
Pakistan
PAK
true
2
1
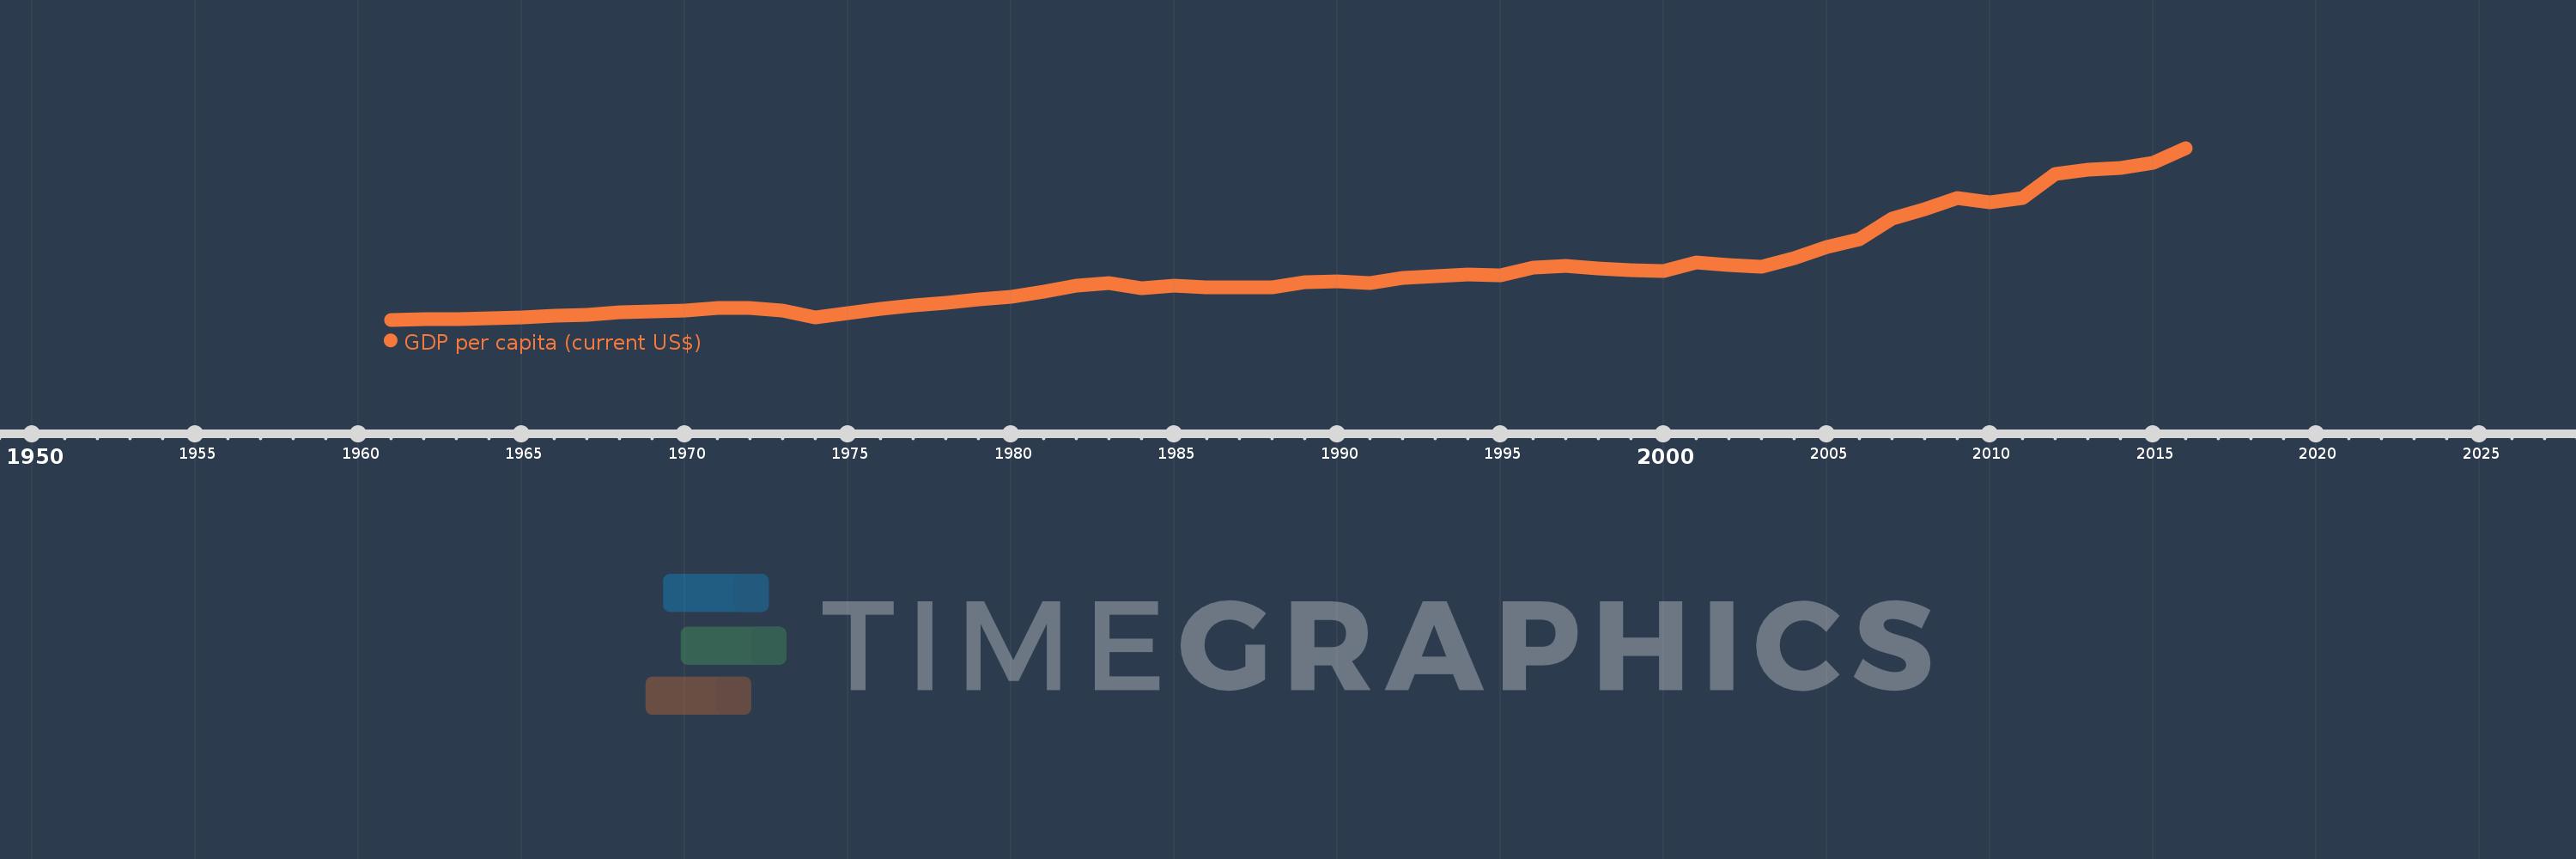
GDP per capita (current US$)
2016,2015,2014,2013,2012,2011,2010,2009,2008,2007,2006,2005,2004,2003,2002,2001,2000,1999,1998,1997,1996,1995,1994,1993,1992,1991,1990,1989,1988,1987,1986,1985,1984,1983,1982,1981,1980,1979,1978,1977,1976,1975,1974,1973,1972,1971,1970,1969,1968,1967,1966,1965,1964,1963,1962,1961
This statistics in other country:
AfghanistanAlbaniaAlgeriaAndorraAngolaAntigua and BarbudaArab WorldArgentinaArmeniaArubaAustraliaAustriaAzerbaijanBahamas, TheBahrainBangladeshBarbadosBelarusBelgiumBelizeBeninBermudaBhutanBoliviaBosnia and HerzegovinaBotswanaBrazilBrunei DarussalamBulgariaBurkina FasoBurundiCabo VerdeCambodiaCameroonCanadaCaribbean small statesCayman IslandsCentral African RepublicCentral Europe and the BalticsChadChannel IslandsChileChinaColombiaComorosCongo, Dem. Rep.Congo, Rep.Costa RicaCote d'IvoireCroatiaCubaCyprusCzech RepublicDenmarkDjiboutiDominicaDominican RepublicEarly-demographic dividendEast Asia & PacificEast Asia & Pacific (excluding high income)East Asia & Pacific (IDA & IBRD countries)EcuadorEgypt, Arab Rep.El SalvadorEquatorial GuineaEritreaEstoniaEthiopiaEuro areaEurope & Central AsiaEurope & Central Asia (excluding high income)Europe & Central Asia (IDA & IBRD countries)European UnionFaroe IslandsFijiFinlandFragile and conflict affected situationsFranceFrench PolynesiaGabonGambia, TheGeorgiaGermanyGhanaGreeceGreenlandGrenadaGuatemalaGuineaGuinea-BissauGuyanaHaitiHeavily indebted poor countries (HIPC)High incomeHondurasHong Kong SAR, ChinaHungaryIBRD onlyIcelandIDA & IBRD totalIDA blendIDA onlyIDA totalIndiaIndonesiaIran, Islamic Rep.IraqIrelandIsle of ManIsraelItalyJamaicaJapanJordanKazakhstanKenyaKiribatiKorea, Rep.KosovoKuwaitKyrgyz RepublicLao PDRLate-demographic dividendLatin America & Caribbean Latin America & Caribbean (excluding high income)Latin America & the Caribbean (IDA & IBRD countries)LatviaLeast developed countries: UN classificationLebanonLesothoLiberiaLibyaLiechtensteinLithuaniaLow & middle incomeLow incomeLower middle incomeLuxembourgMacao SAR, ChinaMacedonia, FYRMadagascarMalawiMalaysiaMaldivesMaliMaltaMarshall IslandsMauritaniaMauritiusMexicoMicronesia, Fed. Sts.Middle East & North AfricaMiddle East & North Africa (excluding high income)Middle East & North Africa (IDA & IBRD countries)Middle incomeMoldovaMonacoMongoliaMontenegroMoroccoMozambiqueMyanmarNamibiaNauruNepalNetherlandsNew CaledoniaNew ZealandNicaraguaNigerNigeriaNorth AmericaNorwayOECD membersOmanOther small statesPacific island small statesPakistanPalauPanamaPapua New GuineaParaguayPeruPhilippinesPolandPortugalPost-demographic dividendPre-demographic dividendPuerto RicoQatarRomaniaRussian FederationRwandaSamoaSan MarinoSao Tome and PrincipeSaudi ArabiaSenegalSerbiaSeychellesSierra LeoneSingaporeSlovak RepublicSloveniaSmall statesSolomon IslandsSomaliaSouth AfricaSouth AsiaSouth Asia (IDA & IBRD)South SudanSpainSri LankaSt. Kitts and NevisSt. LuciaSt. Vincent and the GrenadinesSub-Saharan Africa Sub-Saharan Africa (excluding high income)Sub-Saharan Africa (IDA & IBRD countries)SudanSurinameSwazilandSwedenSwitzerlandSyrian Arab RepublicTajikistanTanzaniaThailandTimor-LesteTogoTongaTrinidad and TobagoTunisiaTurkeyTurkmenistanTuvaluUgandaUkraineUnited Arab EmiratesUnited KingdomUnited StatesUpper middle incomeUruguayUzbekistanVanuatuVenezuela, RBVietnamVirgin Islands (U.S.)West Bank and GazaWorldYemen, Rep.ZambiaZimbabwe Timeline:
This timeline shows a graph from 1961 to 2016 of Pakistan. No data until 1960. Number of actual observations by date: 56.
Source name:
World Development Indicators
Source organization:
World Bank national accounts data, and OECD National Accounts data files.
Categories, topics:
Economy & Growth
Last updated:
apr 23, 2017
Indicators value changes by year
Minimum:
82.541
jan 1, 1961
Maximum:
1.435K
jan 1, 2016
At the date of observation
Value
Absolute change
Change from previous value
jan 1, 1961
82.541
+82.541
0.0%
jan 1, 1962
88.166
+5.625
6.81%
jan 1, 1963
89.831
+1.665
1.89%
jan 1, 1964
93.982
+4.151
4.62%
jan 1, 1965
103.529
+9.547
10.16%
jan 1, 1966
115.73
+12.201
11.79%
jan 1, 1967
123.894
+8.165
7.05%
jan 1, 1968
138.145
+14.251
11.5%
jan 1, 1969
146.97
+8.825
6.39%
jan 1, 1970
152.671
+5.701
3.88%
jan 1, 1971
172.6
+19.929
13.05%
jan 1, 1972
177.617
+5.017
2.91%
jan 1, 1973
151.759
-25.858
-14.56%
jan 1, 1974
100.296
-51.463
-33.91%
jan 1, 1975
135.232
+34.936
34.83%
jan 1, 1976
169.782
+34.55
25.55%
jan 1, 1977
193.821
+24.039
14.16%
jan 1, 1978
213.182
+19.361
9.99%
jan 1, 1979
243.43
+30.249
14.19%
jan 1, 1980
260.77
+17.34
7.12%
jan 1, 1981
303.434
+42.664
16.36%
jan 1, 1982
348.247
+44.813
14.77%
jan 1, 1983
368.295
+20.049
5.76%
jan 1, 1984
332.603
-35.692
-9.69%
jan 1, 1985
349.302
+16.698
5.02%
jan 1, 1986
337.925
-11.376
-3.26%
jan 1, 1987
335.049
-2.876
-0.85%
jan 1, 1988
339.277
+4.228
1.26%
jan 1, 1989
379.338
+40.06
11.81%
jan 1, 1990
384.299
+4.961
1.31%
jan 1, 1991
371.818
-12.481
-3.25%
jan 1, 1992
410.83
+39.013
10.49%
jan 1, 1993
428.066
+17.235
4.2%
jan 1, 1994
441.572
+13.506
3.16%
jan 1, 1995
434.03
-7.542
-1.71%
jan 1, 1996
494.585
+60.555
13.95%
jan 1, 1997
503.749
+9.164
1.85%
jan 1, 1998
484.559
-19.191
-3.81%
jan 1, 1999
471.102
-13.456
-2.78%
jan 1, 2000
465.927
-5.175
-1.1%
jan 1, 2001
534.916
+68.989
14.81%
jan 1, 2002
511.811
-23.105
-4.32%
jan 1, 2003
501.185
-10.626
-2.08%
jan 1, 2004
565.324
+64.138
12.8%
jan 1, 2005
652.02
+86.696
15.34%
jan 1, 2006
714.037
+62.017
9.51%
jan 1, 2007
876.951
+162.914
22.82%
jan 1, 2008
953.796
+76.845
8.76%
jan 1, 2009
1.043K
+89.006
9.33%
jan 1, 2010
1.01K
-33.002
-3.16%
jan 1, 2011
1.043K
+33.501
3.32%
jan 1, 2012
1.23K
+186.549
17.88%
jan 1, 2013
1.265K
+35.052
2.85%
jan 1, 2014
1.276K
+11.192
0.88%
jan 1, 2015
1.321K
+44.461
3.48%
jan 1, 2016
1.435K
+114.143
8.64%
Ranking of countries by current statistics by years


Comments: