29
/
en
AIzaSyAYiBZKx7MnpbEhh9jyipgxe19OcubqV5w
April 1, 2024
169909
Korea, Rep.
KOR
true
2
1
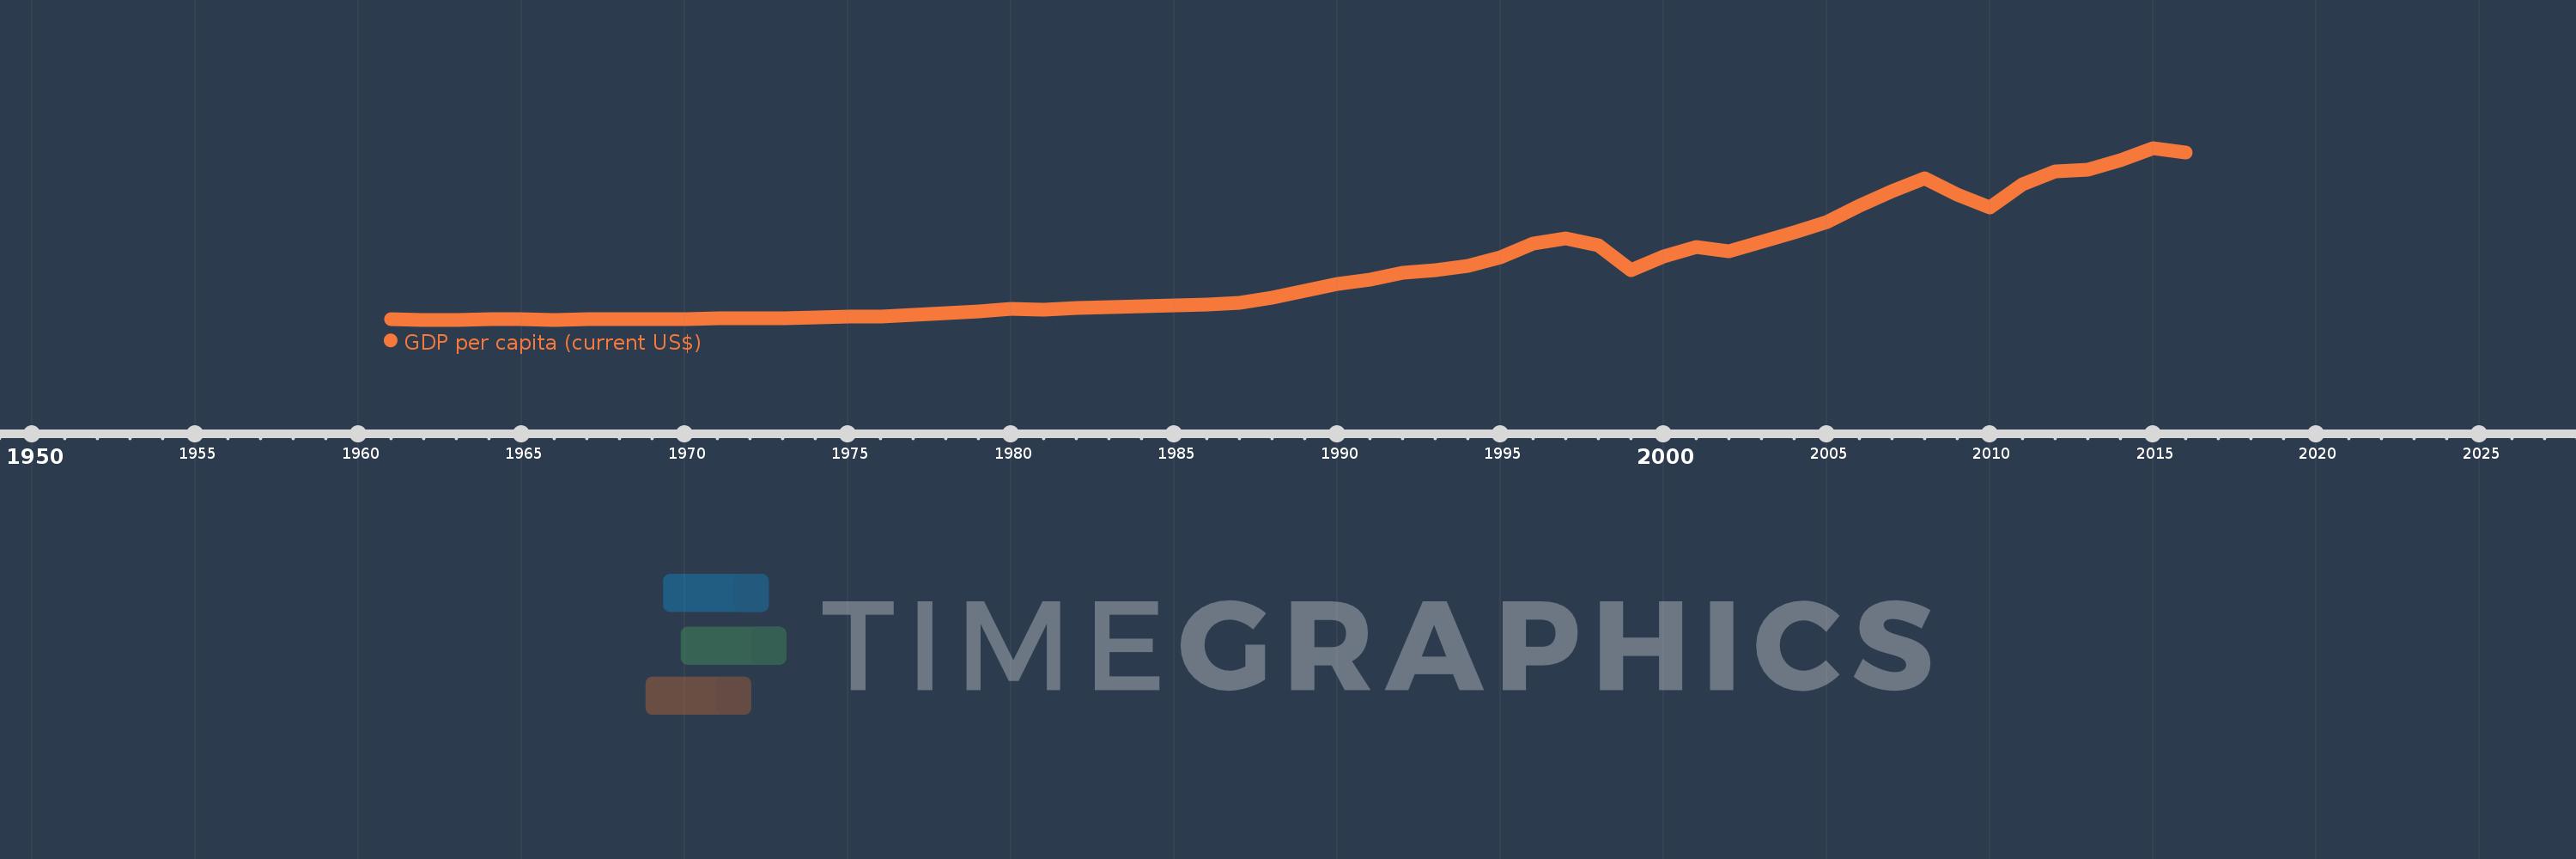
GDP per capita (current US$)
2016,2015,2014,2013,2012,2011,2010,2009,2008,2007,2006,2005,2004,2003,2002,2001,2000,1999,1998,1997,1996,1995,1994,1993,1992,1991,1990,1989,1988,1987,1986,1985,1984,1983,1982,1981,1980,1979,1978,1977,1976,1975,1974,1973,1972,1971,1970,1969,1968,1967,1966,1965,1964,1963,1962,1961
This statistics in other country:
AfghanistanAlbaniaAlgeriaAndorraAngolaAntigua and BarbudaArab WorldArgentinaArmeniaArubaAustraliaAustriaAzerbaijanBahamas, TheBahrainBangladeshBarbadosBelarusBelgiumBelizeBeninBermudaBhutanBoliviaBosnia and HerzegovinaBotswanaBrazilBrunei DarussalamBulgariaBurkina FasoBurundiCabo VerdeCambodiaCameroonCanadaCaribbean small statesCayman IslandsCentral African RepublicCentral Europe and the BalticsChadChannel IslandsChileChinaColombiaComorosCongo, Dem. Rep.Congo, Rep.Costa RicaCote d'IvoireCroatiaCubaCyprusCzech RepublicDenmarkDjiboutiDominicaDominican RepublicEarly-demographic dividendEast Asia & PacificEast Asia & Pacific (excluding high income)East Asia & Pacific (IDA & IBRD countries)EcuadorEgypt, Arab Rep.El SalvadorEquatorial GuineaEritreaEstoniaEthiopiaEuro areaEurope & Central AsiaEurope & Central Asia (excluding high income)Europe & Central Asia (IDA & IBRD countries)European UnionFaroe IslandsFijiFinlandFragile and conflict affected situationsFranceFrench PolynesiaGabonGambia, TheGeorgiaGermanyGhanaGreeceGreenlandGrenadaGuatemalaGuineaGuinea-BissauGuyanaHaitiHeavily indebted poor countries (HIPC)High incomeHondurasHong Kong SAR, ChinaHungaryIBRD onlyIcelandIDA & IBRD totalIDA blendIDA onlyIDA totalIndiaIndonesiaIran, Islamic Rep.IraqIrelandIsle of ManIsraelItalyJamaicaJapanJordanKazakhstanKenyaKiribatiKorea, Rep.KosovoKuwaitKyrgyz RepublicLao PDRLate-demographic dividendLatin America & Caribbean Latin America & Caribbean (excluding high income)Latin America & the Caribbean (IDA & IBRD countries)LatviaLeast developed countries: UN classificationLebanonLesothoLiberiaLibyaLiechtensteinLithuaniaLow & middle incomeLow incomeLower middle incomeLuxembourgMacao SAR, ChinaMacedonia, FYRMadagascarMalawiMalaysiaMaldivesMaliMaltaMarshall IslandsMauritaniaMauritiusMexicoMicronesia, Fed. Sts.Middle East & North AfricaMiddle East & North Africa (excluding high income)Middle East & North Africa (IDA & IBRD countries)Middle incomeMoldovaMonacoMongoliaMontenegroMoroccoMozambiqueMyanmarNamibiaNauruNepalNetherlandsNew CaledoniaNew ZealandNicaraguaNigerNigeriaNorth AmericaNorwayOECD membersOmanOther small statesPacific island small statesPakistanPalauPanamaPapua New GuineaParaguayPeruPhilippinesPolandPortugalPost-demographic dividendPre-demographic dividendPuerto RicoQatarRomaniaRussian FederationRwandaSamoaSan MarinoSao Tome and PrincipeSaudi ArabiaSenegalSerbiaSeychellesSierra LeoneSingaporeSlovak RepublicSloveniaSmall statesSolomon IslandsSomaliaSouth AfricaSouth AsiaSouth Asia (IDA & IBRD)South SudanSpainSri LankaSt. Kitts and NevisSt. LuciaSt. Vincent and the GrenadinesSub-Saharan Africa Sub-Saharan Africa (excluding high income)Sub-Saharan Africa (IDA & IBRD countries)SudanSurinameSwazilandSwedenSwitzerlandSyrian Arab RepublicTajikistanTanzaniaThailandTimor-LesteTogoTongaTrinidad and TobagoTunisiaTurkeyTurkmenistanTuvaluUgandaUkraineUnited Arab EmiratesUnited KingdomUnited StatesUpper middle incomeUruguayUzbekistanVanuatuVenezuela, RBVietnamVirgin Islands (U.S.)West Bank and GazaWorldYemen, Rep.ZambiaZimbabwe Timeline:
This timeline shows a graph from 1961 to 2016 of Korea, Rep.. No data until 1960. Number of actual observations by date: 56.
Source name:
World Development Indicators
Source organization:
World Bank national accounts data, and OECD National Accounts data files.
Categories, topics:
Economy & Growth
Last updated:
apr 23, 2017
Indicators value changes by year
Minimum:
91.481
jan 1, 1962
Maximum:
27.989K
jan 1, 2015
At the date of observation
Value
Absolute change
Change from previous value
jan 1, 1961
155.597
+155.597
0.0%
jan 1, 1962
91.481
-64.116
-41.21%
jan 1, 1963
103.569
+12.089
13.21%
jan 1, 1964
141.727
+38.158
36.84%
jan 1, 1965
120.001
-21.726
-15.33%
jan 1, 1966
105.126
-14.875
-12.4%
jan 1, 1967
129.301
+24.175
23.0%
jan 1, 1968
156.077
+26.776
20.71%
jan 1, 1969
193.115
+37.038
23.73%
jan 1, 1970
236.991
+43.876
22.72%
jan 1, 1971
291.859
+54.868
23.15%
jan 1, 1972
316.831
+24.972
8.56%
jan 1, 1973
339.275
+22.444
7.08%
jan 1, 1974
426.304
+87.029
25.65%
jan 1, 1975
588.791
+162.487
38.12%
jan 1, 1976
646.175
+57.384
9.75%
jan 1, 1977
874.64
+228.465
35.36%
jan 1, 1978
1.106K
+230.93
26.4%
jan 1, 1979
1.468K
+362.511
32.79%
jan 1, 1980
1.858K
+389.738
26.55%
jan 1, 1981
1.778K
-79.339
-4.27%
jan 1, 1982
1.969K
+190.388
10.71%
jan 1, 1983
2.076K
+107.073
5.44%
jan 1, 1984
2.268K
+192.239
9.26%
jan 1, 1985
2.474K
+206.29
9.09%
jan 1, 1986
2.542K
+67.571
2.73%
jan 1, 1987
2.906K
+364.127
14.32%
jan 1, 1988
3.628K
+721.433
24.82%
jan 1, 1989
4.813K
+1.186K
32.69%
jan 1, 1990
5.86K
+1.047K
21.75%
jan 1, 1991
6.642K
+782.047
13.34%
jan 1, 1992
7.676K
+1.033K
15.56%
jan 1, 1993
8.14K
+464.526
6.05%
jan 1, 1994
8.869K
+728.802
8.95%
jan 1, 1995
10.275K
+1.406K
15.86%
jan 1, 1996
12.404K
+2.129K
20.72%
jan 1, 1997
13.255K
+850.724
6.86%
jan 1, 1998
12.197K
-1.058K
-7.98%
jan 1, 1999
8.134K
-4.063K
-33.31%
jan 1, 2000
10.432K
+2.298K
28.26%
jan 1, 2001
11.948K
+1.515K
14.53%
jan 1, 2002
11.256K
-691.629
-5.79%
jan 1, 2003
12.789K
+1.533K
13.62%
jan 1, 2004
14.219K
+1.431K
11.19%
jan 1, 2005
15.922K
+1.703K
11.97%
jan 1, 2006
18.658K
+2.736K
17.18%
jan 1, 2007
20.917K
+2.26K
12.11%
jan 1, 2008
23.102K
+2.184K
10.44%
jan 1, 2009
20.475K
-2.627K
-11.37%
jan 1, 2010
18.339K
-2.136K
-10.43%
jan 1, 2011
22.151K
+3.813K
20.79%
jan 1, 2012
24.156K
+2.005K
9.05%
jan 1, 2013
24.454K
+298.142
1.23%
jan 1, 2014
25.998K
+1.544K
6.31%
jan 1, 2015
27.989K
+1.991K
7.66%
jan 1, 2016
27.222K
-767.83
-2.74%
Ranking of countries by current statistics by years


Comments: