29
/
en
AIzaSyAYiBZKx7MnpbEhh9jyipgxe19OcubqV5w
April 1, 2024
26512
Early-demographic dividend
EAR
false
2
1
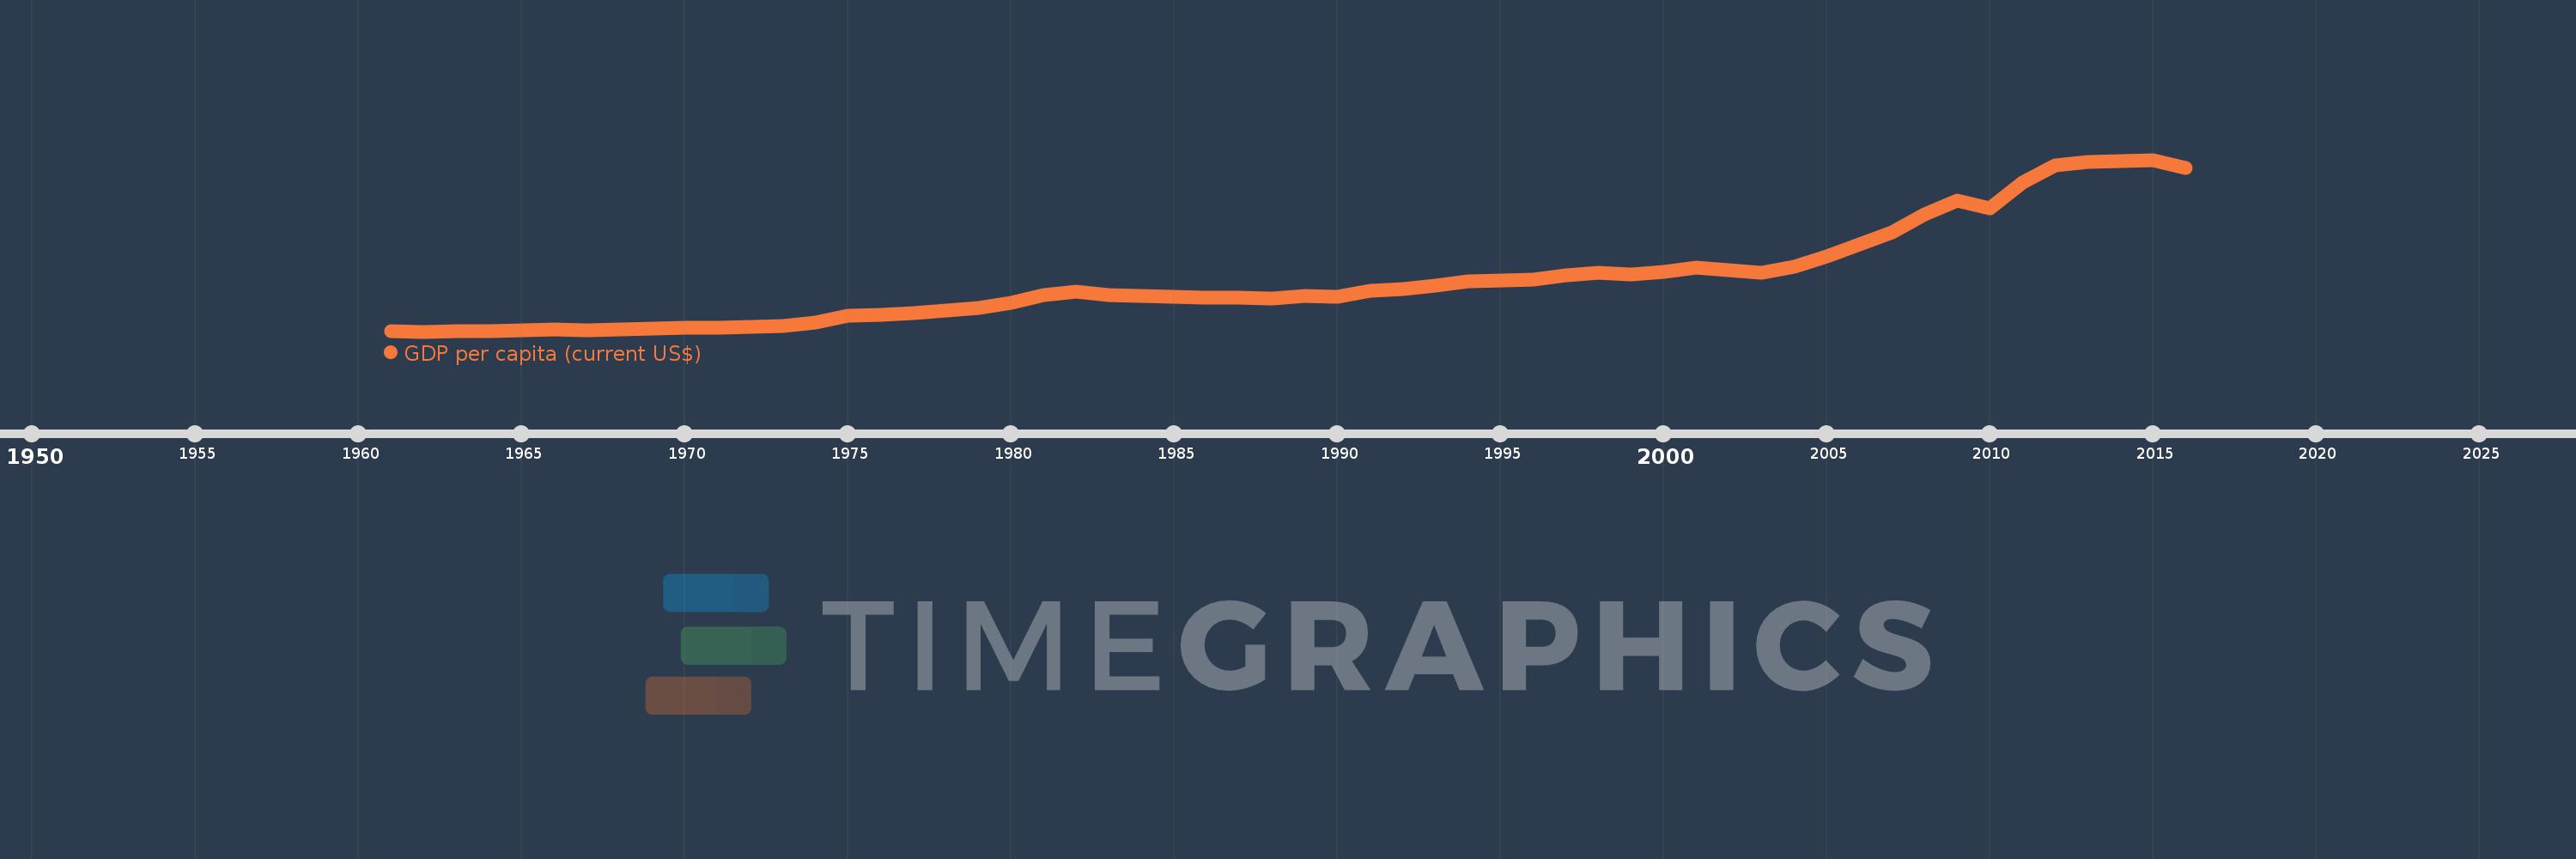
GDP per capita (current US$)
2016,2015,2014,2013,2012,2011,2010,2009,2008,2007,2006,2005,2004,2003,2002,2001,2000,1999,1998,1997,1996,1995,1994,1993,1992,1991,1990,1989,1988,1987,1986,1985,1984,1983,1982,1981,1980,1979,1978,1977,1976,1975,1974,1973,1972,1971,1970,1969,1968,1967,1966,1965,1964,1963,1962,1961
This statistics in other country:
AfghanistanAlbaniaAlgeriaAndorraAngolaAntigua and BarbudaArab WorldArgentinaArmeniaArubaAustraliaAustriaAzerbaijanBahamas, TheBahrainBangladeshBarbadosBelarusBelgiumBelizeBeninBermudaBhutanBoliviaBosnia and HerzegovinaBotswanaBrazilBrunei DarussalamBulgariaBurkina FasoBurundiCabo VerdeCambodiaCameroonCanadaCaribbean small statesCayman IslandsCentral African RepublicCentral Europe and the BalticsChadChannel IslandsChileChinaColombiaComorosCongo, Dem. Rep.Congo, Rep.Costa RicaCote d'IvoireCroatiaCubaCyprusCzech RepublicDenmarkDjiboutiDominicaDominican RepublicEarly-demographic dividendEast Asia & PacificEast Asia & Pacific (excluding high income)East Asia & Pacific (IDA & IBRD countries)EcuadorEgypt, Arab Rep.El SalvadorEquatorial GuineaEritreaEstoniaEthiopiaEuro areaEurope & Central AsiaEurope & Central Asia (excluding high income)Europe & Central Asia (IDA & IBRD countries)European UnionFaroe IslandsFijiFinlandFragile and conflict affected situationsFranceFrench PolynesiaGabonGambia, TheGeorgiaGermanyGhanaGreeceGreenlandGrenadaGuatemalaGuineaGuinea-BissauGuyanaHaitiHeavily indebted poor countries (HIPC)High incomeHondurasHong Kong SAR, ChinaHungaryIBRD onlyIcelandIDA & IBRD totalIDA blendIDA onlyIDA totalIndiaIndonesiaIran, Islamic Rep.IraqIrelandIsle of ManIsraelItalyJamaicaJapanJordanKazakhstanKenyaKiribatiKorea, Rep.KosovoKuwaitKyrgyz RepublicLao PDRLate-demographic dividendLatin America & Caribbean Latin America & Caribbean (excluding high income)Latin America & the Caribbean (IDA & IBRD countries)LatviaLeast developed countries: UN classificationLebanonLesothoLiberiaLibyaLiechtensteinLithuaniaLow & middle incomeLow incomeLower middle incomeLuxembourgMacao SAR, ChinaMacedonia, FYRMadagascarMalawiMalaysiaMaldivesMaliMaltaMarshall IslandsMauritaniaMauritiusMexicoMicronesia, Fed. Sts.Middle East & North AfricaMiddle East & North Africa (excluding high income)Middle East & North Africa (IDA & IBRD countries)Middle incomeMoldovaMonacoMongoliaMontenegroMoroccoMozambiqueMyanmarNamibiaNauruNepalNetherlandsNew CaledoniaNew ZealandNicaraguaNigerNigeriaNorth AmericaNorwayOECD membersOmanOther small statesPacific island small statesPakistanPalauPanamaPapua New GuineaParaguayPeruPhilippinesPolandPortugalPost-demographic dividendPre-demographic dividendPuerto RicoQatarRomaniaRussian FederationRwandaSamoaSan MarinoSao Tome and PrincipeSaudi ArabiaSenegalSerbiaSeychellesSierra LeoneSingaporeSlovak RepublicSloveniaSmall statesSolomon IslandsSomaliaSouth AfricaSouth AsiaSouth Asia (IDA & IBRD)South SudanSpainSri LankaSt. Kitts and NevisSt. LuciaSt. Vincent and the GrenadinesSub-Saharan Africa Sub-Saharan Africa (excluding high income)Sub-Saharan Africa (IDA & IBRD countries)SudanSurinameSwazilandSwedenSwitzerlandSyrian Arab RepublicTajikistanTanzaniaThailandTimor-LesteTogoTongaTrinidad and TobagoTunisiaTurkeyTurkmenistanTuvaluUgandaUkraineUnited Arab EmiratesUnited KingdomUnited StatesUpper middle incomeUruguayUzbekistanVanuatuVenezuela, RBVietnamVirgin Islands (U.S.)West Bank and GazaWorldYemen, Rep.ZambiaZimbabwe Timeline:
This timeline shows a graph from 1961 to 2016 of Early-demographic dividend. No data until 1960. Number of actual observations by date: 56.
Source name:
World Development Indicators
Source organization:
World Bank national accounts data, and OECD National Accounts data files.
Categories, topics:
Economy & Growth
Last updated:
apr 23, 2017
Indicators value changes by year
Minimum:
137.476
jan 1, 1962
Maximum:
3.336K
jan 1, 2015
At the date of observation
Value
Absolute change
Change from previous value
jan 1, 1961
139.819
+139.819
0.0%
jan 1, 1962
137.476
-2.343
-1.68%
jan 1, 1963
139.247
+1.77
1.29%
jan 1, 1964
152.405
+13.158
9.45%
jan 1, 1965
165.388
+12.983
8.52%
jan 1, 1966
175.699
+10.311
6.23%
jan 1, 1967
168.251
-7.448
-4.24%
jan 1, 1968
178.016
+9.766
5.8%
jan 1, 1969
188.041
+10.025
5.63%
jan 1, 1970
203.568
+15.527
8.26%
jan 1, 1971
211.209
+7.641
3.75%
jan 1, 1972
223.302
+12.093
5.73%
jan 1, 1973
247.932
+24.629
11.03%
jan 1, 1974
312.032
+64.1
25.85%
jan 1, 1975
426.683
+114.651
36.74%
jan 1, 1976
449.749
+23.067
5.41%
jan 1, 1977
482.085
+32.336
7.19%
jan 1, 1978
526.796
+44.711
9.27%
jan 1, 1979
569.356
+42.56
8.08%
jan 1, 1980
674.823
+105.466
18.52%
jan 1, 1981
812.11
+137.287
20.34%
jan 1, 1982
884.625
+72.516
8.93%
jan 1, 1983
821.404
-63.222
-7.15%
jan 1, 1984
808.857
-12.547
-1.53%
jan 1, 1985
777.623
-31.233
-3.86%
jan 1, 1986
776.974
-0.649
-0.08%
jan 1, 1987
769.261
-7.713
-0.99%
jan 1, 1988
756.943
-12.318
-1.6%
jan 1, 1989
794.401
+37.458
4.95%
jan 1, 1990
792.749
-1.653
-0.21%
jan 1, 1991
891.887
+99.138
12.51%
jan 1, 1992
923.314
+31.427
3.52%
jan 1, 1993
992.505
+69.19
7.49%
jan 1, 1994
1.069K
+76.13
7.67%
jan 1, 1995
1.096K
+27.751
2.6%
jan 1, 1996
1.102K
+5.652
0.52%
jan 1, 1997
1.179K
+77.298
7.01%
jan 1, 1998
1.236K
+56.475
4.79%
jan 1, 1999
1.193K
-42.365
-3.43%
jan 1, 2000
1.243K
+49.083
4.11%
jan 1, 2001
1.323K
+80.438
6.47%
jan 1, 2002
1.285K
-38.106
-2.88%
jan 1, 2003
1.227K
-58.267
-4.53%
jan 1, 2004
1.348K
+121.724
9.92%
jan 1, 2005
1.541K
+192.373
14.27%
jan 1, 2006
1.767K
+226.335
14.69%
jan 1, 2007
1.99K
+223.435
12.64%
jan 1, 2008
2.314K
+323.203
16.24%
jan 1, 2009
2.569K
+255.733
11.05%
jan 1, 2010
2.434K
-135.895
-5.29%
jan 1, 2011
2.909K
+475.816
19.55%
jan 1, 2012
3.225K
+316.062
10.86%
jan 1, 2013
3.298K
+72.779
2.26%
jan 1, 2014
3.319K
+20.399
0.62%
jan 1, 2015
3.336K
+17.664
0.53%
jan 1, 2016
3.188K
-148.523
-4.45%
Ranking of countries by current statistics by years


Comments: