29
/
en
AIzaSyAYiBZKx7MnpbEhh9jyipgxe19OcubqV5w
April 1, 2024
55524
Pre-demographic dividend
PRE
false
2
1
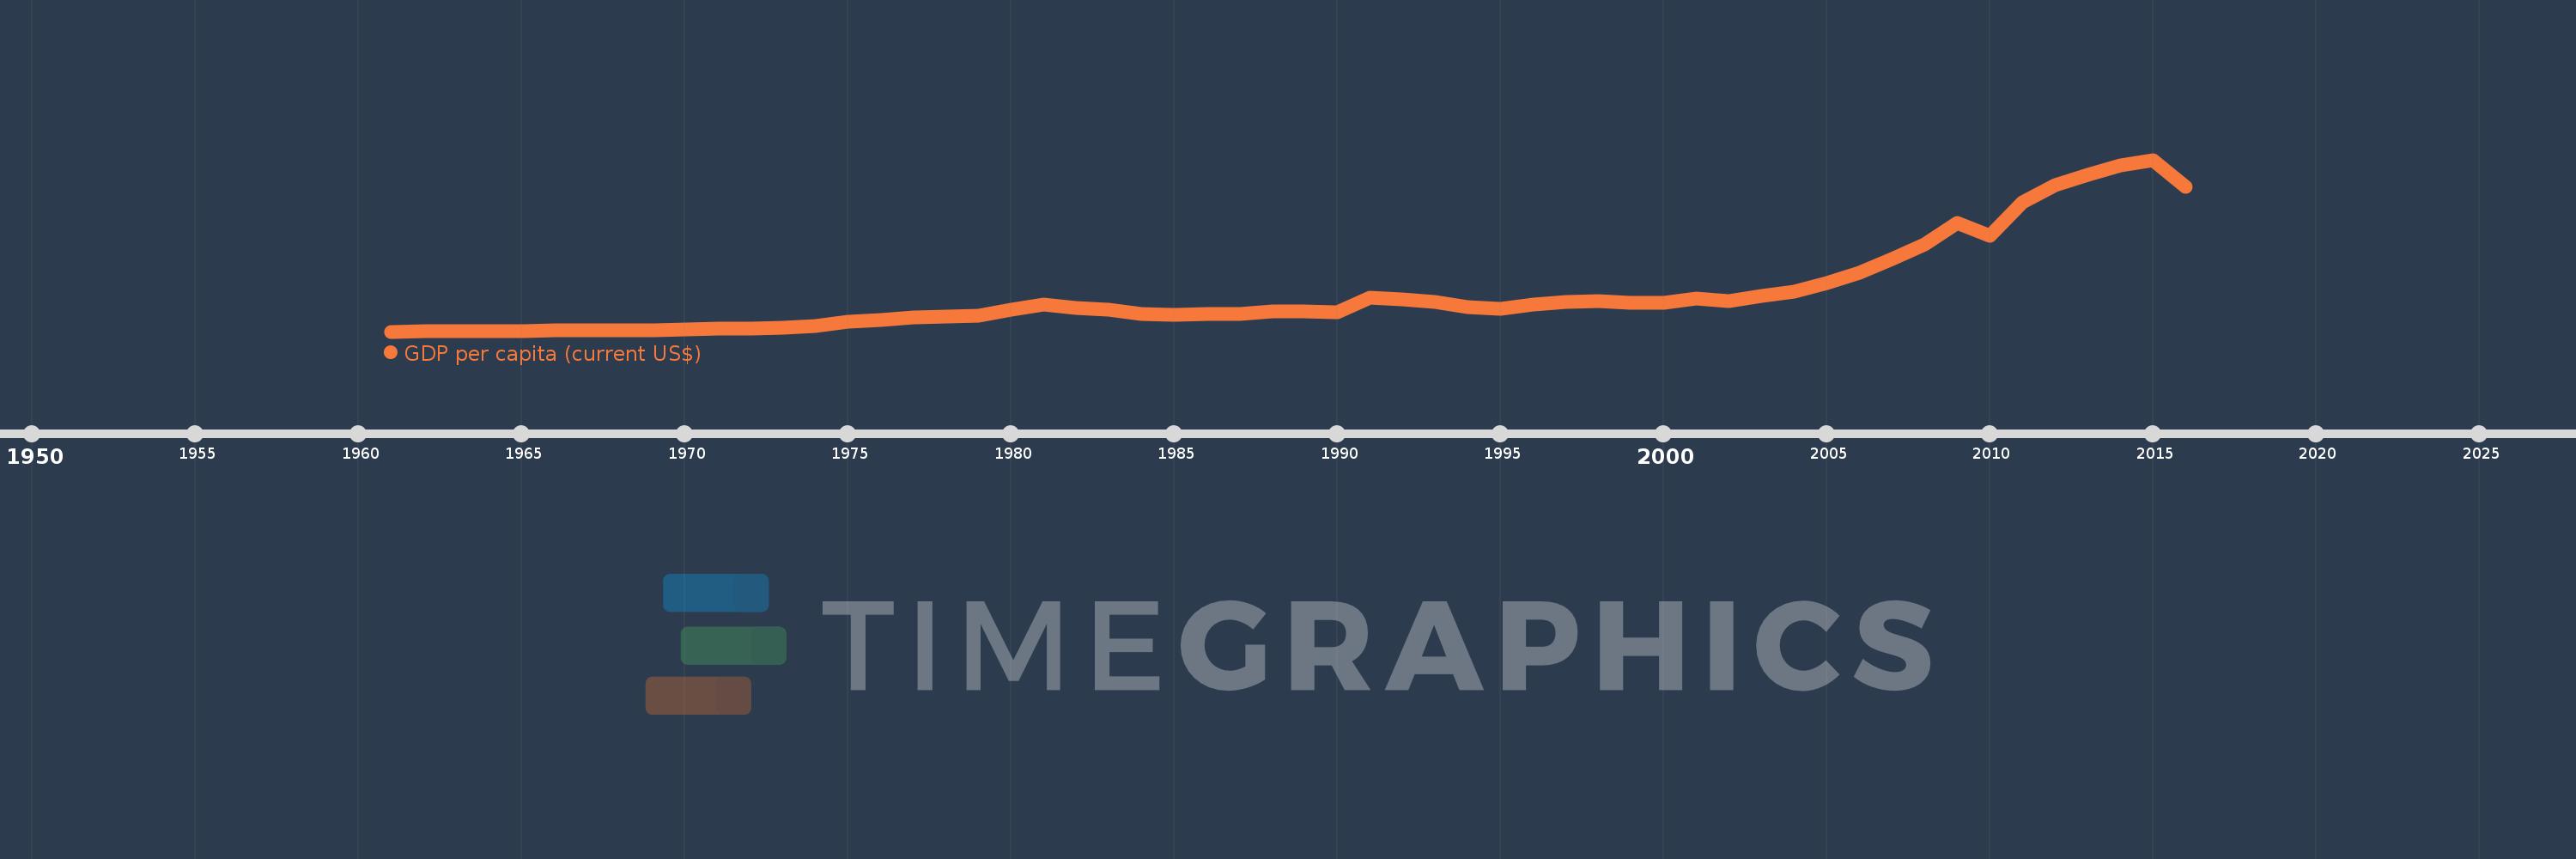
GDP per capita (current US$)
2016,2015,2014,2013,2012,2011,2010,2009,2008,2007,2006,2005,2004,2003,2002,2001,2000,1999,1998,1997,1996,1995,1994,1993,1992,1991,1990,1989,1988,1987,1986,1985,1984,1983,1982,1981,1980,1979,1978,1977,1976,1975,1974,1973,1972,1971,1970,1969,1968,1967,1966,1965,1964,1963,1962,1961
This statistics in other country:
AfghanistanAlbaniaAlgeriaAndorraAngolaAntigua and BarbudaArab WorldArgentinaArmeniaArubaAustraliaAustriaAzerbaijanBahamas, TheBahrainBangladeshBarbadosBelarusBelgiumBelizeBeninBermudaBhutanBoliviaBosnia and HerzegovinaBotswanaBrazilBrunei DarussalamBulgariaBurkina FasoBurundiCabo VerdeCambodiaCameroonCanadaCaribbean small statesCayman IslandsCentral African RepublicCentral Europe and the BalticsChadChannel IslandsChileChinaColombiaComorosCongo, Dem. Rep.Congo, Rep.Costa RicaCote d'IvoireCroatiaCubaCyprusCzech RepublicDenmarkDjiboutiDominicaDominican RepublicEarly-demographic dividendEast Asia & PacificEast Asia & Pacific (excluding high income)East Asia & Pacific (IDA & IBRD countries)EcuadorEgypt, Arab Rep.El SalvadorEquatorial GuineaEritreaEstoniaEthiopiaEuro areaEurope & Central AsiaEurope & Central Asia (excluding high income)Europe & Central Asia (IDA & IBRD countries)European UnionFaroe IslandsFijiFinlandFragile and conflict affected situationsFranceFrench PolynesiaGabonGambia, TheGeorgiaGermanyGhanaGreeceGreenlandGrenadaGuatemalaGuineaGuinea-BissauGuyanaHaitiHeavily indebted poor countries (HIPC)High incomeHondurasHong Kong SAR, ChinaHungaryIBRD onlyIcelandIDA & IBRD totalIDA blendIDA onlyIDA totalIndiaIndonesiaIran, Islamic Rep.IraqIrelandIsle of ManIsraelItalyJamaicaJapanJordanKazakhstanKenyaKiribatiKorea, Rep.KosovoKuwaitKyrgyz RepublicLao PDRLate-demographic dividendLatin America & Caribbean Latin America & Caribbean (excluding high income)Latin America & the Caribbean (IDA & IBRD countries)LatviaLeast developed countries: UN classificationLebanonLesothoLiberiaLibyaLiechtensteinLithuaniaLow & middle incomeLow incomeLower middle incomeLuxembourgMacao SAR, ChinaMacedonia, FYRMadagascarMalawiMalaysiaMaldivesMaliMaltaMarshall IslandsMauritaniaMauritiusMexicoMicronesia, Fed. Sts.Middle East & North AfricaMiddle East & North Africa (excluding high income)Middle East & North Africa (IDA & IBRD countries)Middle incomeMoldovaMonacoMongoliaMontenegroMoroccoMozambiqueMyanmarNamibiaNauruNepalNetherlandsNew CaledoniaNew ZealandNicaraguaNigerNigeriaNorth AmericaNorwayOECD membersOmanOther small statesPacific island small statesPakistanPalauPanamaPapua New GuineaParaguayPeruPhilippinesPolandPortugalPost-demographic dividendPre-demographic dividendPuerto RicoQatarRomaniaRussian FederationRwandaSamoaSan MarinoSao Tome and PrincipeSaudi ArabiaSenegalSerbiaSeychellesSierra LeoneSingaporeSlovak RepublicSloveniaSmall statesSolomon IslandsSomaliaSouth AfricaSouth AsiaSouth Asia (IDA & IBRD)South SudanSpainSri LankaSt. Kitts and NevisSt. LuciaSt. Vincent and the GrenadinesSub-Saharan Africa Sub-Saharan Africa (excluding high income)Sub-Saharan Africa (IDA & IBRD countries)SudanSurinameSwazilandSwedenSwitzerlandSyrian Arab RepublicTajikistanTanzaniaThailandTimor-LesteTogoTongaTrinidad and TobagoTunisiaTurkeyTurkmenistanTuvaluUgandaUkraineUnited Arab EmiratesUnited KingdomUnited StatesUpper middle incomeUruguayUzbekistanVanuatuVenezuela, RBVietnamVirgin Islands (U.S.)West Bank and GazaWorldYemen, Rep.ZambiaZimbabwe Timeline:
This timeline shows a graph from 1961 to 2016 of Pre-demographic dividend. No data until 1960. Number of actual observations by date: 56.
Source name:
World Development Indicators
Source organization:
World Bank national accounts data, and OECD National Accounts data files.
Categories, topics:
Economy & Growth
Last updated:
apr 23, 2017
Indicators value changes by year
Minimum:
45.599
jan 1, 1961
Maximum:
1.795K
jan 1, 2015
At the date of observation
Value
Absolute change
Change from previous value
jan 1, 1961
45.599
+45.599
0.0%
jan 1, 1962
47.213
+1.613
3.54%
jan 1, 1963
49.236
+2.024
4.29%
jan 1, 1964
50.997
+1.761
3.58%
jan 1, 1965
54.335
+3.338
6.55%
jan 1, 1966
57.364
+3.028
5.57%
jan 1, 1967
61.264
+3.9
6.8%
jan 1, 1968
58.937
-2.326
-3.8%
jan 1, 1969
59.599
+0.662
1.12%
jan 1, 1970
64.618
+5.018
8.42%
jan 1, 1971
80.04
+15.422
23.87%
jan 1, 1972
74.353
-5.687
-7.1%
jan 1, 1973
84.612
+10.259
13.8%
jan 1, 1974
100.378
+15.766
18.63%
jan 1, 1975
143.209
+42.831
42.67%
jan 1, 1976
159.618
+16.408
11.46%
jan 1, 1977
187.253
+27.635
17.31%
jan 1, 1978
198.384
+11.131
5.94%
jan 1, 1979
210.961
+12.578
6.34%
jan 1, 1980
267.016
+56.055
26.57%
jan 1, 1981
324.619
+57.603
21.57%
jan 1, 1982
284.696
-39.922
-12.3%
jan 1, 1983
265.322
-19.374
-6.81%
jan 1, 1984
221.682
-43.64
-16.45%
jan 1, 1985
217.945
-3.738
-1.69%
jan 1, 1986
221.964
+4.019
1.84%
jan 1, 1987
221.79
-0.173
-0.08%
jan 1, 1988
248.597
+26.807
12.09%
jan 1, 1989
247.647
-0.95
-0.38%
jan 1, 1990
245.807
-1.84
-0.74%
jan 1, 1991
391.148
+145.341
59.13%
jan 1, 1992
372.773
-18.375
-4.7%
jan 1, 1993
346.428
-26.345
-7.07%
jan 1, 1994
295.665
-50.763
-14.65%
jan 1, 1995
276.195
-19.47
-6.59%
jan 1, 1996
321.76
+45.565
16.5%
jan 1, 1997
349.315
+27.555
8.56%
jan 1, 1998
354.797
+5.483
1.57%
jan 1, 1999
341.7
-13.097
-3.69%
jan 1, 2000
337.632
-4.068
-1.19%
jan 1, 2001
383.304
+45.672
13.53%
jan 1, 2002
353.241
-30.063
-7.84%
jan 1, 2003
405.441
+52.199
14.78%
jan 1, 2004
455.232
+49.791
12.28%
jan 1, 2005
536.139
+80.907
17.77%
jan 1, 2006
645.487
+109.348
20.4%
jan 1, 2007
783.17
+137.683
21.33%
jan 1, 2008
931.749
+148.579
18.97%
jan 1, 2009
1.156K
+223.757
24.01%
jan 1, 2010
1.017K
-138.086
-11.95%
jan 1, 2011
1.366K
+348.646
34.27%
jan 1, 2012
1.534K
+168.383
12.33%
jan 1, 2013
1.639K
+104.052
6.78%
jan 1, 2014
1.739K
+100.78
6.15%
jan 1, 2015
1.795K
+55.704
3.2%
jan 1, 2016
1.521K
-273.828
-15.26%
Ranking of countries by current statistics by years


Comments: