29
/
en
AIzaSyAYiBZKx7MnpbEhh9jyipgxe19OcubqV5w
April 1, 2024
127347
Equatorial Guinea
GNQ
true
2
1
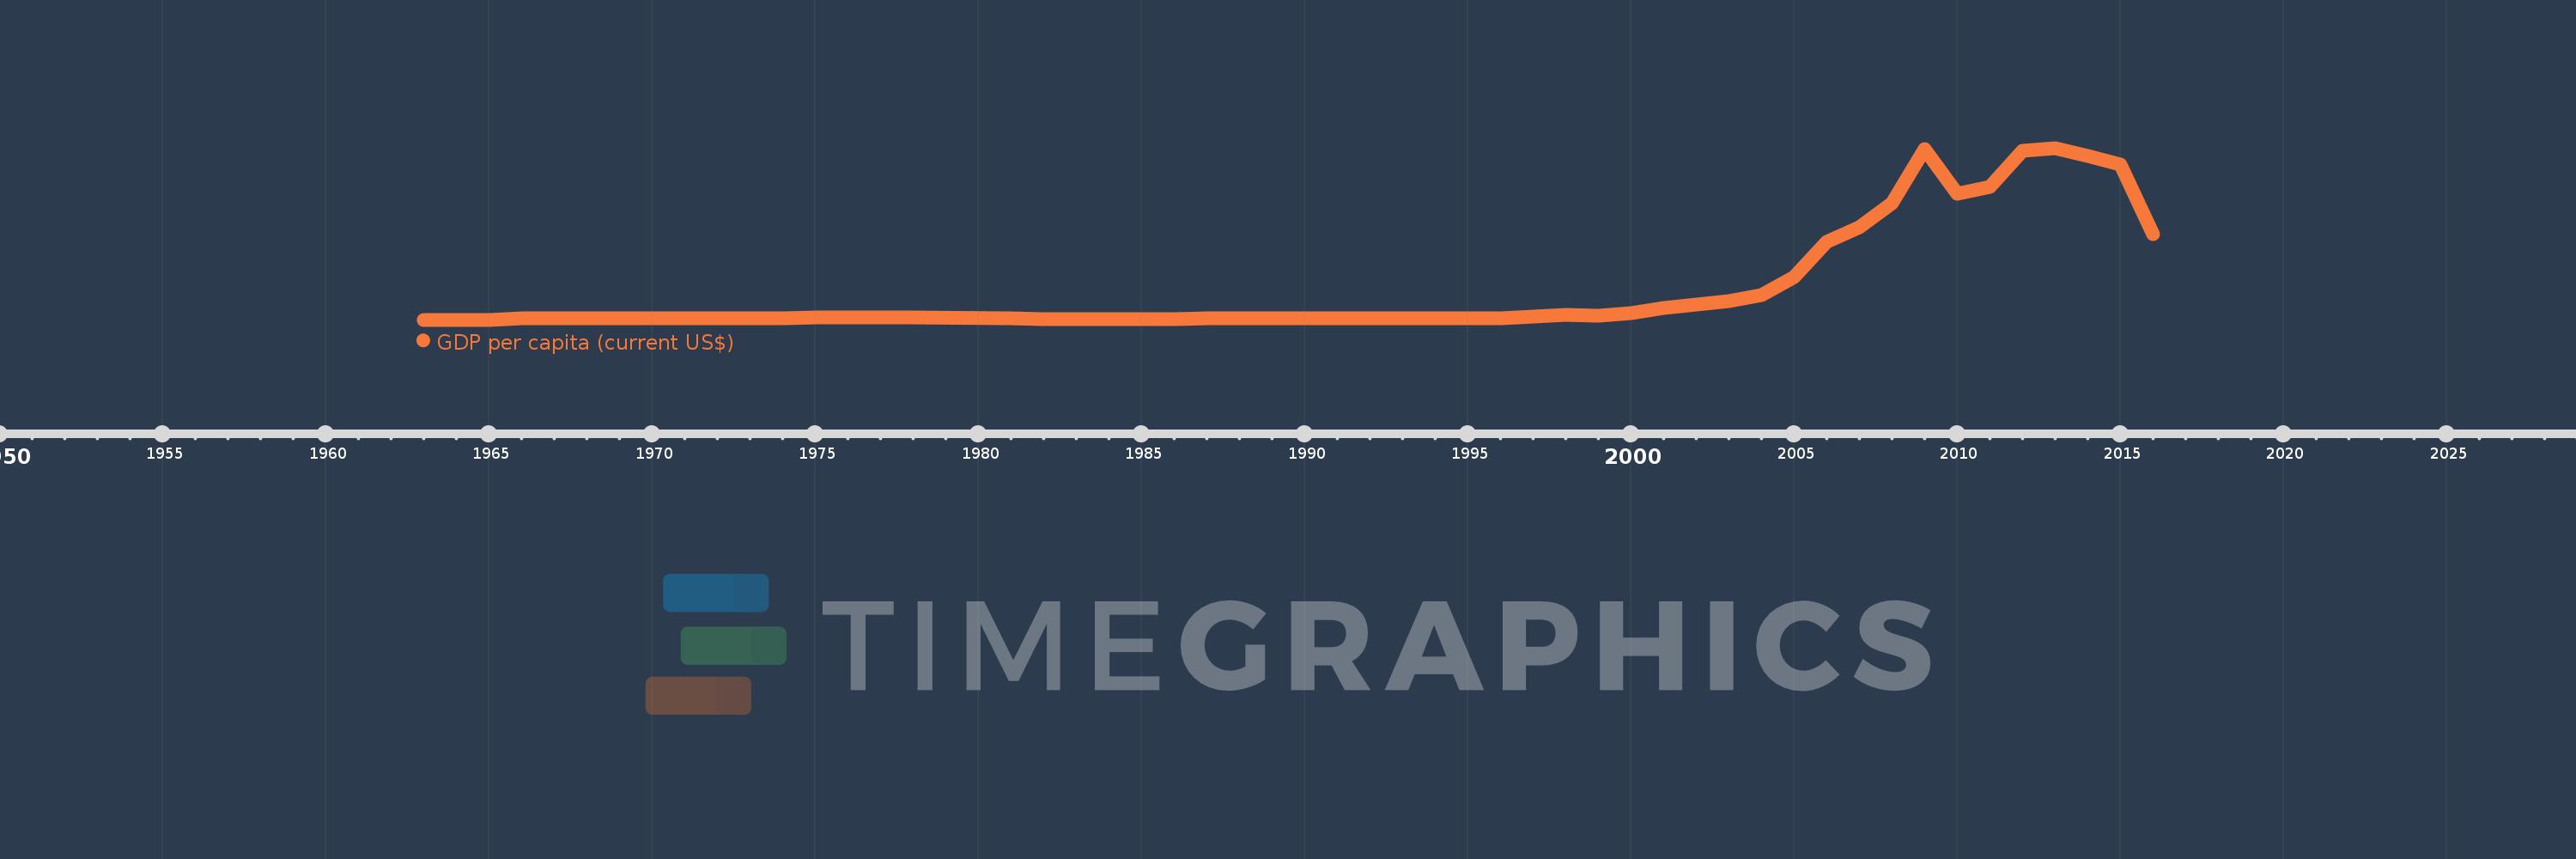
GDP per capita (current US$)
2016,2015,2014,2013,2012,2011,2010,2009,2008,2007,2006,2005,2004,2003,2002,2001,2000,1999,1998,1997,1996,1995,1994,1993,1992,1991,1990,1989,1988,1987,1986,1985,1984,1983,1982,1981,1978,1977,1976,1975,1974,1973,1972,1971,1970,1969,1968,1967,1966,1965,1964,1963
This statistics in other country:
AfghanistanAlbaniaAlgeriaAndorraAngolaAntigua and BarbudaArab WorldArgentinaArmeniaArubaAustraliaAustriaAzerbaijanBahamas, TheBahrainBangladeshBarbadosBelarusBelgiumBelizeBeninBermudaBhutanBoliviaBosnia and HerzegovinaBotswanaBrazilBrunei DarussalamBulgariaBurkina FasoBurundiCabo VerdeCambodiaCameroonCanadaCaribbean small statesCayman IslandsCentral African RepublicCentral Europe and the BalticsChadChannel IslandsChileChinaColombiaComorosCongo, Dem. Rep.Congo, Rep.Costa RicaCote d'IvoireCroatiaCubaCyprusCzech RepublicDenmarkDjiboutiDominicaDominican RepublicEarly-demographic dividendEast Asia & PacificEast Asia & Pacific (excluding high income)East Asia & Pacific (IDA & IBRD countries)EcuadorEgypt, Arab Rep.El SalvadorEquatorial GuineaEritreaEstoniaEthiopiaEuro areaEurope & Central AsiaEurope & Central Asia (excluding high income)Europe & Central Asia (IDA & IBRD countries)European UnionFaroe IslandsFijiFinlandFragile and conflict affected situationsFranceFrench PolynesiaGabonGambia, TheGeorgiaGermanyGhanaGreeceGreenlandGrenadaGuatemalaGuineaGuinea-BissauGuyanaHaitiHeavily indebted poor countries (HIPC)High incomeHondurasHong Kong SAR, ChinaHungaryIBRD onlyIcelandIDA & IBRD totalIDA blendIDA onlyIDA totalIndiaIndonesiaIran, Islamic Rep.IraqIrelandIsle of ManIsraelItalyJamaicaJapanJordanKazakhstanKenyaKiribatiKorea, Rep.KosovoKuwaitKyrgyz RepublicLao PDRLate-demographic dividendLatin America & Caribbean Latin America & Caribbean (excluding high income)Latin America & the Caribbean (IDA & IBRD countries)LatviaLeast developed countries: UN classificationLebanonLesothoLiberiaLibyaLiechtensteinLithuaniaLow & middle incomeLow incomeLower middle incomeLuxembourgMacao SAR, ChinaMacedonia, FYRMadagascarMalawiMalaysiaMaldivesMaliMaltaMarshall IslandsMauritaniaMauritiusMexicoMicronesia, Fed. Sts.Middle East & North AfricaMiddle East & North Africa (excluding high income)Middle East & North Africa (IDA & IBRD countries)Middle incomeMoldovaMonacoMongoliaMontenegroMoroccoMozambiqueMyanmarNamibiaNauruNepalNetherlandsNew CaledoniaNew ZealandNicaraguaNigerNigeriaNorth AmericaNorwayOECD membersOmanOther small statesPacific island small statesPakistanPalauPanamaPapua New GuineaParaguayPeruPhilippinesPolandPortugalPost-demographic dividendPre-demographic dividendPuerto RicoQatarRomaniaRussian FederationRwandaSamoaSan MarinoSao Tome and PrincipeSaudi ArabiaSenegalSerbiaSeychellesSierra LeoneSingaporeSlovak RepublicSloveniaSmall statesSolomon IslandsSomaliaSouth AfricaSouth AsiaSouth Asia (IDA & IBRD)South SudanSpainSri LankaSt. Kitts and NevisSt. LuciaSt. Vincent and the GrenadinesSub-Saharan Africa Sub-Saharan Africa (excluding high income)Sub-Saharan Africa (IDA & IBRD countries)SudanSurinameSwazilandSwedenSwitzerlandSyrian Arab RepublicTajikistanTanzaniaThailandTimor-LesteTogoTongaTrinidad and TobagoTunisiaTurkeyTurkmenistanTuvaluUgandaUkraineUnited Arab EmiratesUnited KingdomUnited StatesUpper middle incomeUruguayUzbekistanVanuatuVenezuela, RBVietnamVirgin Islands (U.S.)West Bank and GazaWorldYemen, Rep.ZambiaZimbabwe Timeline:
This timeline shows a graph from 1963 to 2016 of Equatorial Guinea. No data until 1962. Number of actual observations by date: 52.
Source name:
World Development Indicators
Source organization:
World Bank national accounts data, and OECD National Accounts data files.
Categories, topics:
Economy & Growth
Last updated:
apr 23, 2017
Indicators value changes by year
Minimum:
35.368
jan 1, 1963
Maximum:
28.937K
jan 1, 2013
At the date of observation
Value
Absolute change
Change from previous value
jan 1, 1963
35.368
+35.368
0.0%
jan 1, 1964
41.535
+6.167
17.44%
jan 1, 1965
48.018
+6.484
15.61%
jan 1, 1966
240.319
+192.3
400.47%
jan 1, 1967
250.88
+10.562
4.39%
jan 1, 1968
256.041
+5.16
2.06%
jan 1, 1969
233.855
-22.185
-8.66%
jan 1, 1970
230.214
-3.641
-1.56%
jan 1, 1971
228.017
-2.197
-0.95%
jan 1, 1972
227.952
-0.065
-0.03%
jan 1, 1973
238.006
+10.054
4.41%
jan 1, 1974
309.465
+71.459
30.02%
jan 1, 1975
377.263
+67.798
21.91%
jan 1, 1976
437.776
+60.513
16.04%
jan 1, 1977
453.642
+15.866
3.62%
jan 1, 1978
471.915
+18.274
4.03%
jan 1, 1981
229.564
-242.352
-51.35%
jan 1, 1982
157.69
-71.873
-31.31%
jan 1, 1983
176.261
+18.571
11.78%
jan 1, 1984
162.674
-13.587
-7.71%
jan 1, 1985
170.527
+7.853
4.83%
jan 1, 1986
197.574
+27.046
15.86%
jan 1, 1987
231.364
+33.791
17.1%
jan 1, 1988
271.915
+40.551
17.53%
jan 1, 1989
283.605
+11.69
4.3%
jan 1, 1990
241.526
-42.079
-14.84%
jan 1, 1991
297.113
+55.587
23.01%
jan 1, 1992
284.097
-13.016
-4.38%
jan 1, 1993
333.367
+49.27
17.34%
jan 1, 1994
325.155
-8.212
-2.46%
jan 1, 1995
232.705
-92.451
-28.43%
jan 1, 1996
316.403
+83.698
35.97%
jan 1, 1997
501.166
+184.764
58.4%
jan 1, 1998
921.852
+420.686
83.94%
jan 1, 1999
746.857
-174.995
-18.98%
jan 1, 2000
1.21K
+463.081
62.0%
jan 1, 2001
1.97K
+760.314
62.84%
jan 1, 2002
2.661K
+691.17
35.08%
jan 1, 2003
3.183K
+521.346
19.59%
jan 1, 2004
4.235K
+1.052K
33.05%
jan 1, 2005
7.276K
+3.041K
71.82%
jan 1, 2006
13.13K
+5.854K
80.45%
jan 1, 2007
15.621K
+2.491K
18.97%
jan 1, 2008
19.633K
+4.013K
25.69%
jan 1, 2009
28.781K
+9.147K
46.59%
jan 1, 2010
21.251K
-7.53K
-26.16%
jan 1, 2011
22.366K
+1.115K
5.25%
jan 1, 2012
28.404K
+6.038K
27.0%
jan 1, 2013
28.937K
+532.871
1.88%
jan 1, 2014
27.529K
-1.409K
-4.87%
jan 1, 2015
26.145K
-1.384K
-5.03%
jan 1, 2016
14.44K
-11.705K
-44.77%
Ranking of countries by current statistics by years


Comments: