29
/
en
AIzaSyAYiBZKx7MnpbEhh9jyipgxe19OcubqV5w
April 1, 2024
231044
Rwanda
RWA
true
2
1
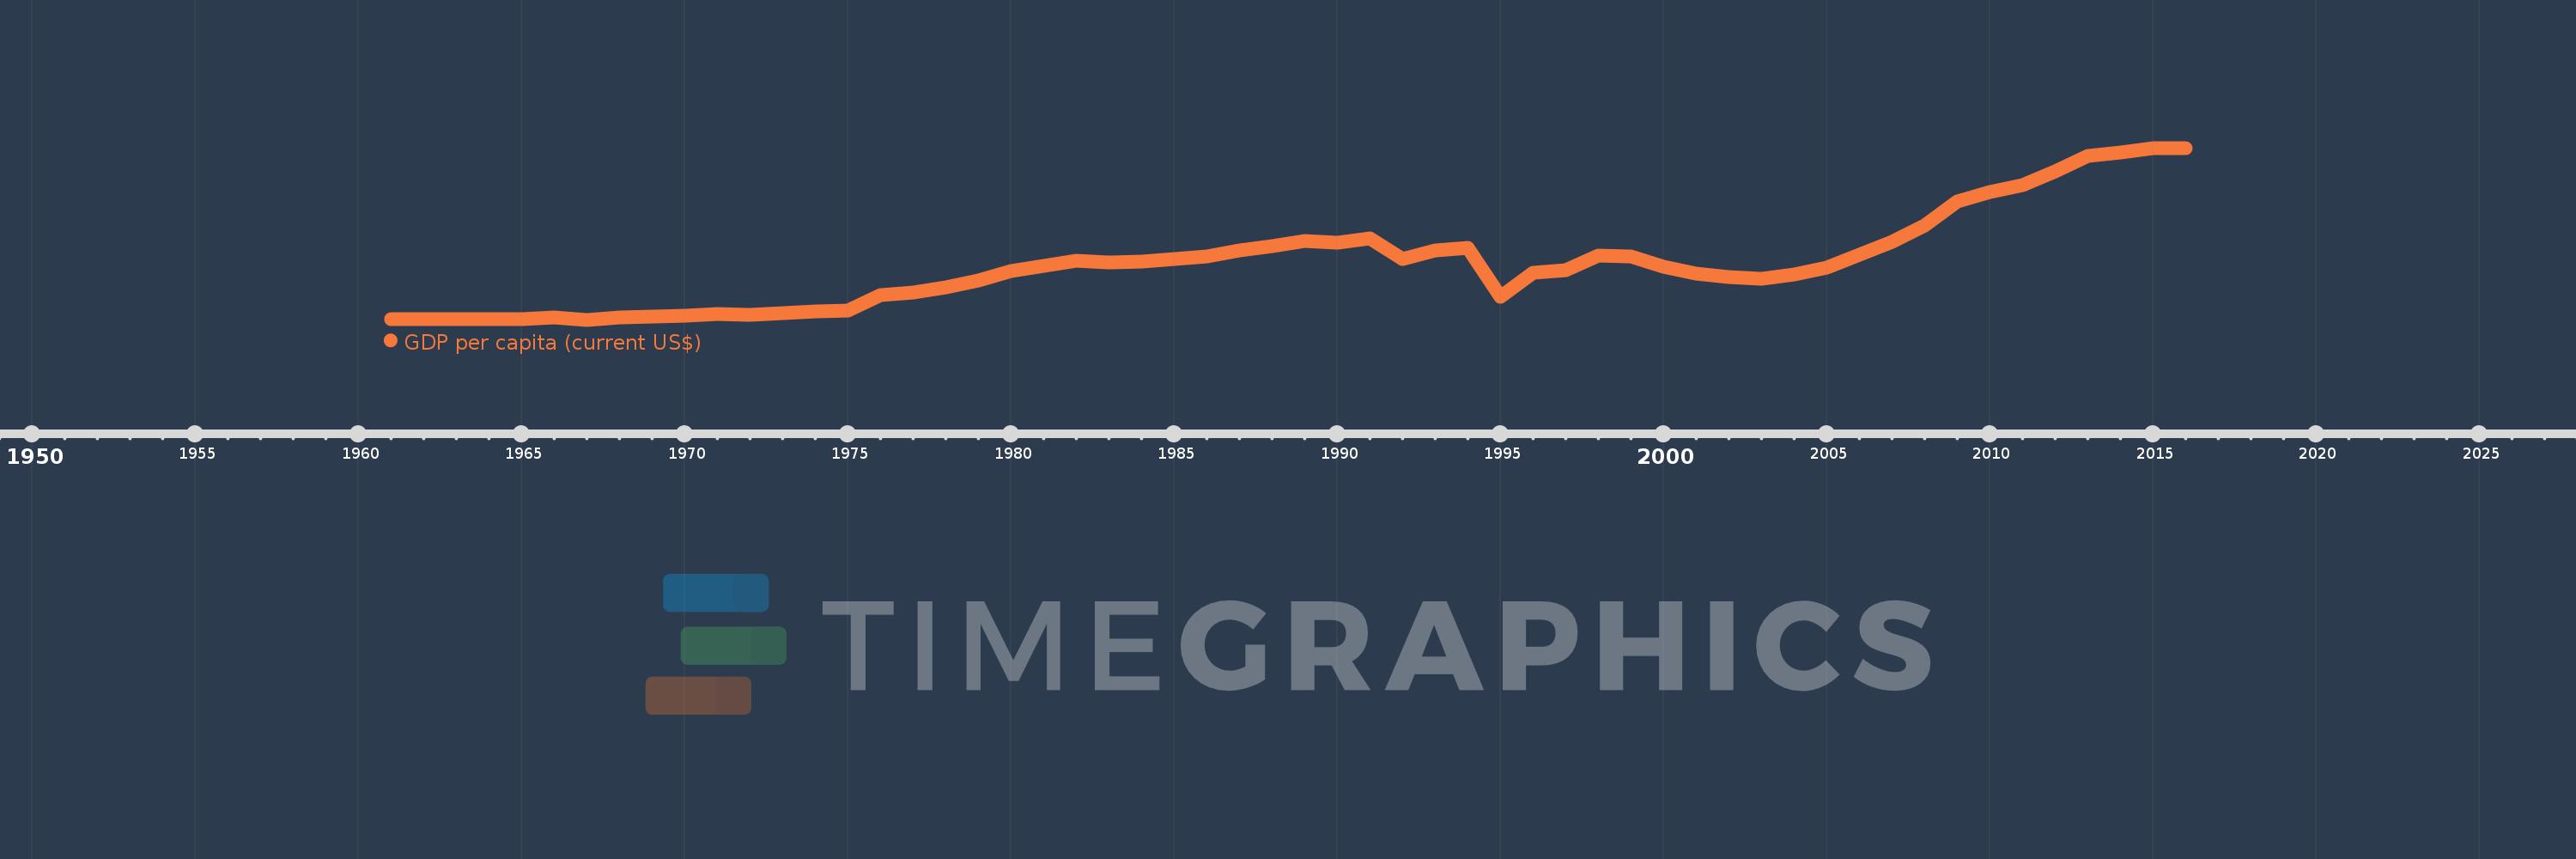
GDP per capita (current US$)
2016,2015,2014,2013,2012,2011,2010,2009,2008,2007,2006,2005,2004,2003,2002,2001,2000,1999,1998,1997,1996,1995,1994,1993,1992,1991,1990,1989,1988,1987,1986,1985,1984,1983,1982,1981,1980,1979,1978,1977,1976,1975,1974,1973,1972,1971,1970,1969,1968,1967,1966,1965,1964,1963,1962,1961
This statistics in other country:
AfghanistanAlbaniaAlgeriaAndorraAngolaAntigua and BarbudaArab WorldArgentinaArmeniaArubaAustraliaAustriaAzerbaijanBahamas, TheBahrainBangladeshBarbadosBelarusBelgiumBelizeBeninBermudaBhutanBoliviaBosnia and HerzegovinaBotswanaBrazilBrunei DarussalamBulgariaBurkina FasoBurundiCabo VerdeCambodiaCameroonCanadaCaribbean small statesCayman IslandsCentral African RepublicCentral Europe and the BalticsChadChannel IslandsChileChinaColombiaComorosCongo, Dem. Rep.Congo, Rep.Costa RicaCote d'IvoireCroatiaCubaCyprusCzech RepublicDenmarkDjiboutiDominicaDominican RepublicEarly-demographic dividendEast Asia & PacificEast Asia & Pacific (excluding high income)East Asia & Pacific (IDA & IBRD countries)EcuadorEgypt, Arab Rep.El SalvadorEquatorial GuineaEritreaEstoniaEthiopiaEuro areaEurope & Central AsiaEurope & Central Asia (excluding high income)Europe & Central Asia (IDA & IBRD countries)European UnionFaroe IslandsFijiFinlandFragile and conflict affected situationsFranceFrench PolynesiaGabonGambia, TheGeorgiaGermanyGhanaGreeceGreenlandGrenadaGuatemalaGuineaGuinea-BissauGuyanaHaitiHeavily indebted poor countries (HIPC)High incomeHondurasHong Kong SAR, ChinaHungaryIBRD onlyIcelandIDA & IBRD totalIDA blendIDA onlyIDA totalIndiaIndonesiaIran, Islamic Rep.IraqIrelandIsle of ManIsraelItalyJamaicaJapanJordanKazakhstanKenyaKiribatiKorea, Rep.KosovoKuwaitKyrgyz RepublicLao PDRLate-demographic dividendLatin America & Caribbean Latin America & Caribbean (excluding high income)Latin America & the Caribbean (IDA & IBRD countries)LatviaLeast developed countries: UN classificationLebanonLesothoLiberiaLibyaLiechtensteinLithuaniaLow & middle incomeLow incomeLower middle incomeLuxembourgMacao SAR, ChinaMacedonia, FYRMadagascarMalawiMalaysiaMaldivesMaliMaltaMarshall IslandsMauritaniaMauritiusMexicoMicronesia, Fed. Sts.Middle East & North AfricaMiddle East & North Africa (excluding high income)Middle East & North Africa (IDA & IBRD countries)Middle incomeMoldovaMonacoMongoliaMontenegroMoroccoMozambiqueMyanmarNamibiaNauruNepalNetherlandsNew CaledoniaNew ZealandNicaraguaNigerNigeriaNorth AmericaNorwayOECD membersOmanOther small statesPacific island small statesPakistanPalauPanamaPapua New GuineaParaguayPeruPhilippinesPolandPortugalPost-demographic dividendPre-demographic dividendPuerto RicoQatarRomaniaRussian FederationRwandaSamoaSan MarinoSao Tome and PrincipeSaudi ArabiaSenegalSerbiaSeychellesSierra LeoneSingaporeSlovak RepublicSloveniaSmall statesSolomon IslandsSomaliaSouth AfricaSouth AsiaSouth Asia (IDA & IBRD)South SudanSpainSri LankaSt. Kitts and NevisSt. LuciaSt. Vincent and the GrenadinesSub-Saharan Africa Sub-Saharan Africa (excluding high income)Sub-Saharan Africa (IDA & IBRD countries)SudanSurinameSwazilandSwedenSwitzerlandSyrian Arab RepublicTajikistanTanzaniaThailandTimor-LesteTogoTongaTrinidad and TobagoTunisiaTurkeyTurkmenistanTuvaluUgandaUkraineUnited Arab EmiratesUnited KingdomUnited StatesUpper middle incomeUruguayUzbekistanVanuatuVenezuela, RBVietnamVirgin Islands (U.S.)West Bank and GazaWorldYemen, Rep.ZambiaZimbabwe Timeline:
This timeline shows a graph from 1961 to 2016 of Rwanda. No data until 1960. Number of actual observations by date: 56.
Source name:
World Development Indicators
Source organization:
World Bank national accounts data, and OECD National Accounts data files.
Categories, topics:
Economy & Growth
Last updated:
apr 23, 2017
Indicators value changes by year
Minimum:
37.518
jan 1, 1967
Maximum:
697.627
jan 1, 2015
At the date of observation
Value
Absolute change
Change from previous value
jan 1, 1961
40.567
+40.567
0.0%
jan 1, 1962
40.72
+0.153
0.38%
jan 1, 1963
40.976
+0.256
0.63%
jan 1, 1964
41.251
+0.275
0.67%
jan 1, 1965
41.117
-0.134
-0.32%
jan 1, 1966
46.026
+4.909
11.94%
jan 1, 1967
37.518
-8.508
-18.49%
jan 1, 1968
46.678
+9.16
24.41%
jan 1, 1969
48.82
+2.142
4.59%
jan 1, 1970
51.832
+3.012
6.17%
jan 1, 1971
58.569
+6.737
13.0%
jan 1, 1972
57.635
-0.934
-1.59%
jan 1, 1973
61.866
+4.231
7.34%
jan 1, 1974
70.873
+9.007
14.56%
jan 1, 1975
72.976
+2.103
2.97%
jan 1, 1976
131.186
+58.21
79.77%
jan 1, 1977
141.732
+10.546
8.04%
jan 1, 1978
160.637
+18.905
13.34%
jan 1, 1979
188.518
+27.881
17.36%
jan 1, 1980
223.27
+34.753
18.43%
jan 1, 1981
244.08
+20.81
9.32%
jan 1, 1982
264.789
+20.708
8.48%
jan 1, 1983
256.495
-8.294
-3.13%
jan 1, 1984
261.002
+4.507
1.76%
jan 1, 1985
270.08
+9.078
3.48%
jan 1, 1986
280.424
+10.344
3.83%
jan 1, 1987
303.359
+22.935
8.18%
jan 1, 1988
319.981
+16.622
5.48%
jan 1, 1989
339.879
+19.899
6.22%
jan 1, 1990
332.227
-7.652
-2.25%
jan 1, 1991
351.278
+19.051
5.73%
jan 1, 1992
270.329
-80.949
-23.04%
jan 1, 1993
302.257
+31.928
11.81%
jan 1, 1994
312.923
+10.666
3.53%
jan 1, 1995
125.69
-187.233
-59.83%
jan 1, 1996
218.77
+93.08
74.06%
jan 1, 1997
226.698
+7.928
3.62%
jan 1, 1998
284.587
+57.889
25.54%
jan 1, 1999
282.289
-2.299
-0.81%
jan 1, 2000
239.634
-42.655
-15.11%
jan 1, 2001
216.276
-23.358
-9.75%
jan 1, 2002
201.064
-15.212
-7.03%
jan 1, 2003
196.445
-4.619
-2.3%
jan 1, 2004
212.512
+16.067
8.18%
jan 1, 2005
236.629
+24.117
11.35%
jan 1, 2006
286.567
+49.938
21.1%
jan 1, 2007
336.942
+50.375
17.58%
jan 1, 2008
398.208
+61.266
18.18%
jan 1, 2009
491.94
+93.732
23.54%
jan 1, 2010
529.597
+37.656
7.65%
jan 1, 2011
553.597
+24.001
4.53%
jan 1, 2012
606.903
+53.305
9.63%
jan 1, 2013
667.415
+60.512
9.97%
jan 1, 2014
678.998
+11.584
1.74%
jan 1, 2015
697.627
+18.628
2.74%
jan 1, 2016
697.348
-0.278
-0.04%
Ranking of countries by current statistics by years


Comments: