29
/
en
AIzaSyAYiBZKx7MnpbEhh9jyipgxe19OcubqV5w
April 1, 2024
193027
Mauritania
MRT
true
2
1
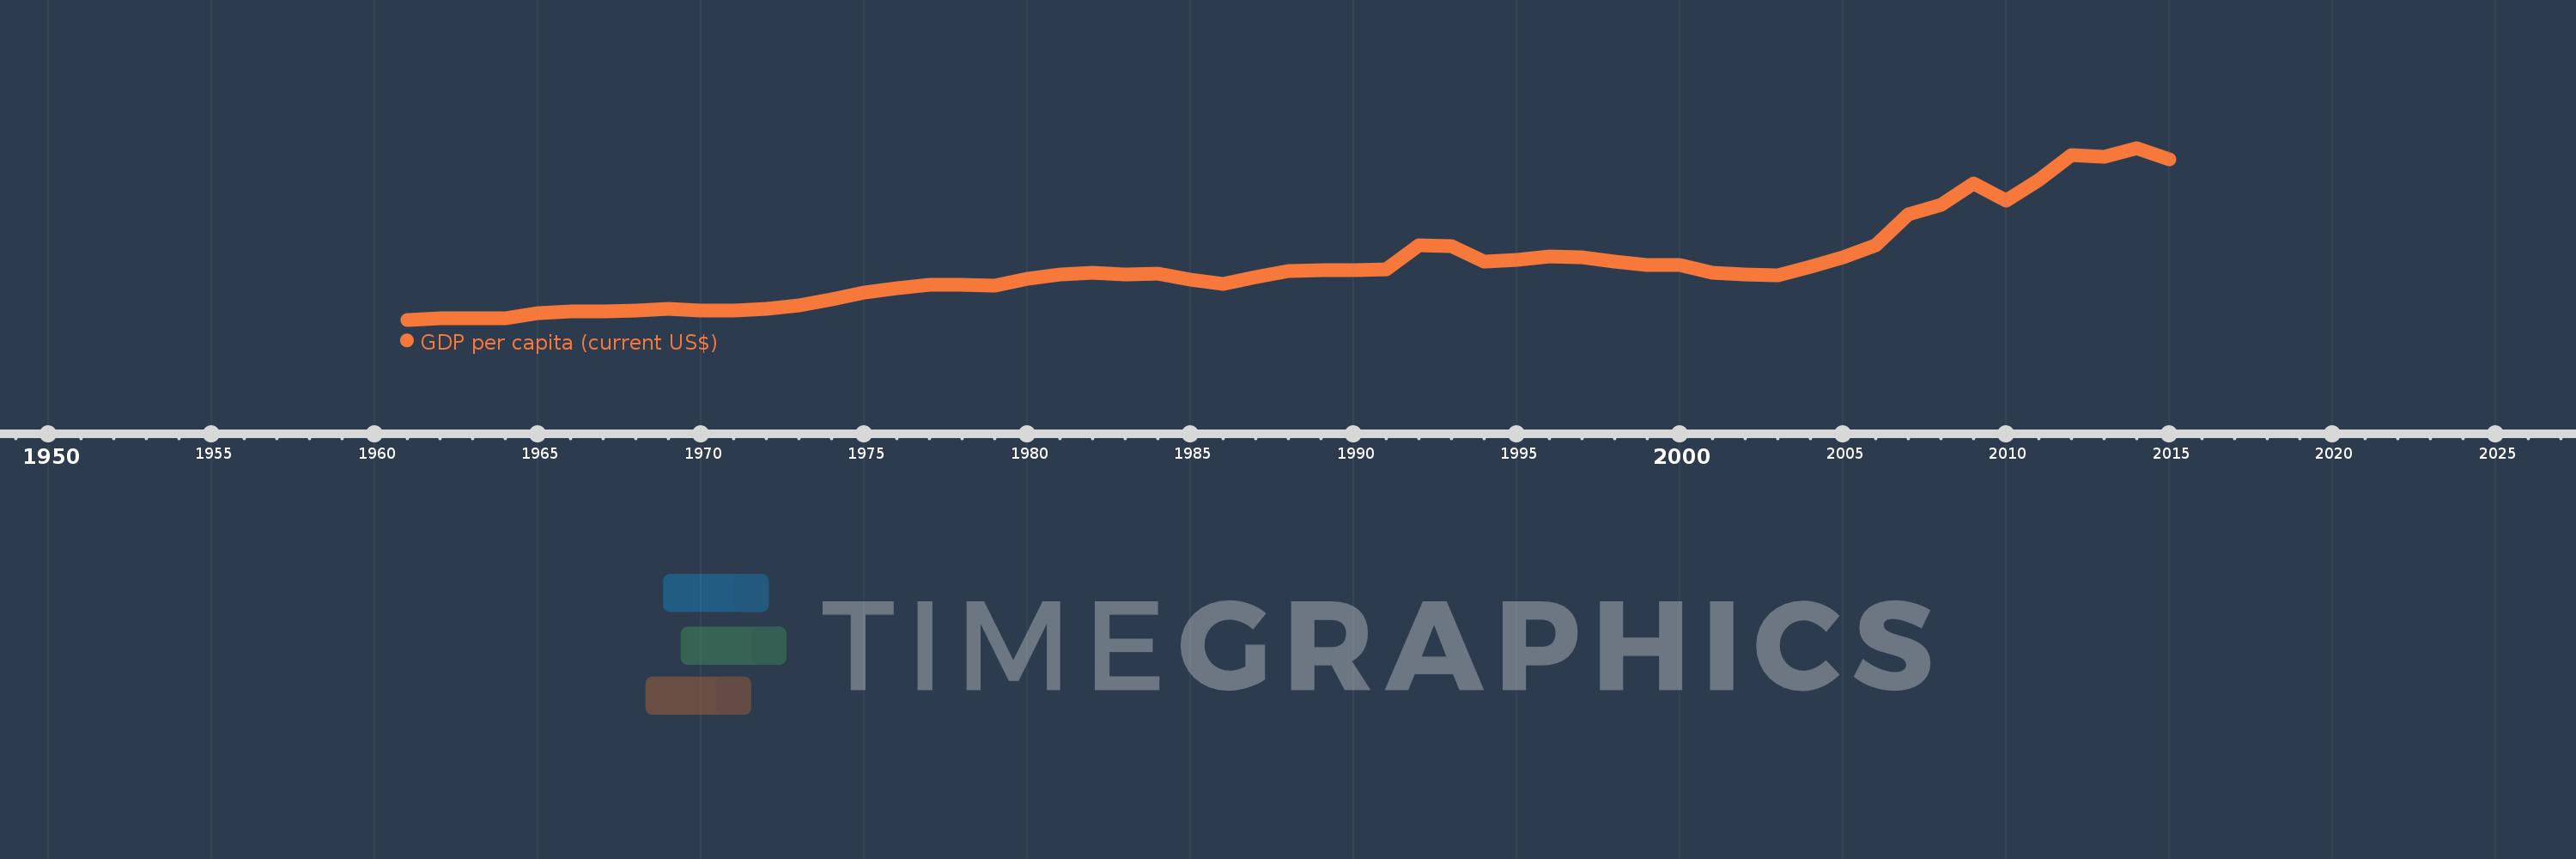
GDP per capita (current US$)
2015,2014,2013,2012,2011,2010,2009,2008,2007,2006,2005,2004,2003,2002,2001,2000,1999,1998,1997,1996,1995,1994,1993,1992,1991,1990,1989,1988,1987,1986,1985,1984,1983,1982,1981,1980,1979,1978,1977,1976,1975,1974,1973,1972,1971,1970,1969,1968,1967,1966,1965,1964,1963,1962,1961
This statistics in other country:
AfghanistanAlbaniaAlgeriaAndorraAngolaAntigua and BarbudaArab WorldArgentinaArmeniaArubaAustraliaAustriaAzerbaijanBahamas, TheBahrainBangladeshBarbadosBelarusBelgiumBelizeBeninBermudaBhutanBoliviaBosnia and HerzegovinaBotswanaBrazilBrunei DarussalamBulgariaBurkina FasoBurundiCabo VerdeCambodiaCameroonCanadaCaribbean small statesCayman IslandsCentral African RepublicCentral Europe and the BalticsChadChannel IslandsChileChinaColombiaComorosCongo, Dem. Rep.Congo, Rep.Costa RicaCote d'IvoireCroatiaCubaCyprusCzech RepublicDenmarkDjiboutiDominicaDominican RepublicEarly-demographic dividendEast Asia & PacificEast Asia & Pacific (excluding high income)East Asia & Pacific (IDA & IBRD countries)EcuadorEgypt, Arab Rep.El SalvadorEquatorial GuineaEritreaEstoniaEthiopiaEuro areaEurope & Central AsiaEurope & Central Asia (excluding high income)Europe & Central Asia (IDA & IBRD countries)European UnionFaroe IslandsFijiFinlandFragile and conflict affected situationsFranceFrench PolynesiaGabonGambia, TheGeorgiaGermanyGhanaGreeceGreenlandGrenadaGuatemalaGuineaGuinea-BissauGuyanaHaitiHeavily indebted poor countries (HIPC)High incomeHondurasHong Kong SAR, ChinaHungaryIBRD onlyIcelandIDA & IBRD totalIDA blendIDA onlyIDA totalIndiaIndonesiaIran, Islamic Rep.IraqIrelandIsle of ManIsraelItalyJamaicaJapanJordanKazakhstanKenyaKiribatiKorea, Rep.KosovoKuwaitKyrgyz RepublicLao PDRLate-demographic dividendLatin America & Caribbean Latin America & Caribbean (excluding high income)Latin America & the Caribbean (IDA & IBRD countries)LatviaLeast developed countries: UN classificationLebanonLesothoLiberiaLibyaLiechtensteinLithuaniaLow & middle incomeLow incomeLower middle incomeLuxembourgMacao SAR, ChinaMacedonia, FYRMadagascarMalawiMalaysiaMaldivesMaliMaltaMarshall IslandsMauritaniaMauritiusMexicoMicronesia, Fed. Sts.Middle East & North AfricaMiddle East & North Africa (excluding high income)Middle East & North Africa (IDA & IBRD countries)Middle incomeMoldovaMonacoMongoliaMontenegroMoroccoMozambiqueMyanmarNamibiaNauruNepalNetherlandsNew CaledoniaNew ZealandNicaraguaNigerNigeriaNorth AmericaNorwayOECD membersOmanOther small statesPacific island small statesPakistanPalauPanamaPapua New GuineaParaguayPeruPhilippinesPolandPortugalPost-demographic dividendPre-demographic dividendPuerto RicoQatarRomaniaRussian FederationRwandaSamoaSan MarinoSao Tome and PrincipeSaudi ArabiaSenegalSerbiaSeychellesSierra LeoneSingaporeSlovak RepublicSloveniaSmall statesSolomon IslandsSomaliaSouth AfricaSouth AsiaSouth Asia (IDA & IBRD)South SudanSpainSri LankaSt. Kitts and NevisSt. LuciaSt. Vincent and the GrenadinesSub-Saharan Africa Sub-Saharan Africa (excluding high income)Sub-Saharan Africa (IDA & IBRD countries)SudanSurinameSwazilandSwedenSwitzerlandSyrian Arab RepublicTajikistanTanzaniaThailandTimor-LesteTogoTongaTrinidad and TobagoTunisiaTurkeyTurkmenistanTuvaluUgandaUkraineUnited Arab EmiratesUnited KingdomUnited StatesUpper middle incomeUruguayUzbekistanVanuatuVenezuela, RBVietnamVirgin Islands (U.S.)West Bank and GazaWorldYemen, Rep.ZambiaZimbabwe Timeline:
This timeline shows a graph from 1961 to 2015 of Mauritania. No data until 1960. Number of actual observations by date: 55.
Source name:
World Development Indicators
Source organization:
World Bank national accounts data, and OECD National Accounts data files.
Categories, topics:
Economy & Growth
Last updated:
apr 23, 2017
Indicators value changes by year
Minimum:
107.915
jan 1, 1961
Maximum:
1.458K
jan 1, 2014
At the date of observation
Value
Absolute change
Change from previous value
jan 1, 1961
107.915
+107.915
0.0%
jan 1, 1962
121.969
+14.055
13.02%
jan 1, 1963
122.253
+0.283
0.23%
jan 1, 1964
121.577
-0.676
-0.55%
jan 1, 1965
157.611
+36.035
29.64%
jan 1, 1966
174.096
+16.485
10.46%
jan 1, 1967
176.479
+2.383
1.37%
jan 1, 1968
181.721
+5.241
2.97%
jan 1, 1969
194.443
+12.722
7.0%
jan 1, 1970
178.926
-15.517
-7.98%
jan 1, 1971
182.215
+3.289
1.84%
jan 1, 1972
191.937
+9.722
5.34%
jan 1, 1973
217.593
+25.656
13.37%
jan 1, 1974
266.168
+48.575
22.32%
jan 1, 1975
321.341
+55.173
20.73%
jan 1, 1976
358.186
+36.845
11.47%
jan 1, 1977
383.44
+25.254
7.05%
jan 1, 1978
384.077
+0.637
0.17%
jan 1, 1979
375.812
-8.266
-2.15%
jan 1, 1980
432.027
+56.215
14.96%
jan 1, 1981
462.192
+30.165
6.98%
jan 1, 1982
473.839
+11.647
2.52%
jan 1, 1983
461.867
-11.972
-2.53%
jan 1, 1984
471.774
+9.907
2.15%
jan 1, 1985
422.972
-48.802
-10.34%
jan 1, 1986
386.672
-36.3
-8.58%
jan 1, 1987
442.195
+55.523
14.36%
jan 1, 1988
487.746
+45.551
10.3%
jan 1, 1989
499.613
+11.866
2.43%
jan 1, 1990
498.524
-1.088
-0.22%
jan 1, 1991
503.839
+5.314
1.07%
jan 1, 1992
693.82
+189.982
37.71%
jan 1, 1993
684.216
-9.605
-1.38%
jan 1, 1994
567.589
-116.627
-17.05%
jan 1, 1995
580.538
+12.949
2.28%
jan 1, 1996
606.391
+25.853
4.45%
jan 1, 1997
600.138
-6.254
-1.03%
jan 1, 1998
566.171
-33.966
-5.66%
jan 1, 1999
538.959
-27.212
-4.81%
jan 1, 2000
534.512
-4.447
-0.83%
jan 1, 2001
477.113
-57.399
-10.74%
jan 1, 2002
463.271
-13.842
-2.9%
jan 1, 2003
459.126
-4.146
-0.89%
jan 1, 2004
525.459
+66.333
14.45%
jan 1, 2005
598.211
+72.752
13.85%
jan 1, 2006
692.576
+94.365
15.77%
jan 1, 2007
937.983
+245.407
35.43%
jan 1, 2008
1.009K
+70.572
7.52%
jan 1, 2009
1.181K
+171.995
17.05%
jan 1, 2010
1.046K
-134.759
-11.41%
jan 1, 2011
1.208K
+162.037
15.49%
jan 1, 2012
1.403K
+194.842
16.13%
jan 1, 2013
1.385K
-17.664
-1.26%
jan 1, 2014
1.458K
+72.832
5.26%
jan 1, 2015
1.371K
-86.851
-5.96%
Ranking of countries by current statistics by years


Comments: