29
/
en
AIzaSyAYiBZKx7MnpbEhh9jyipgxe19OcubqV5w
April 1, 2024
83787
Benin
BEN
true
2
1
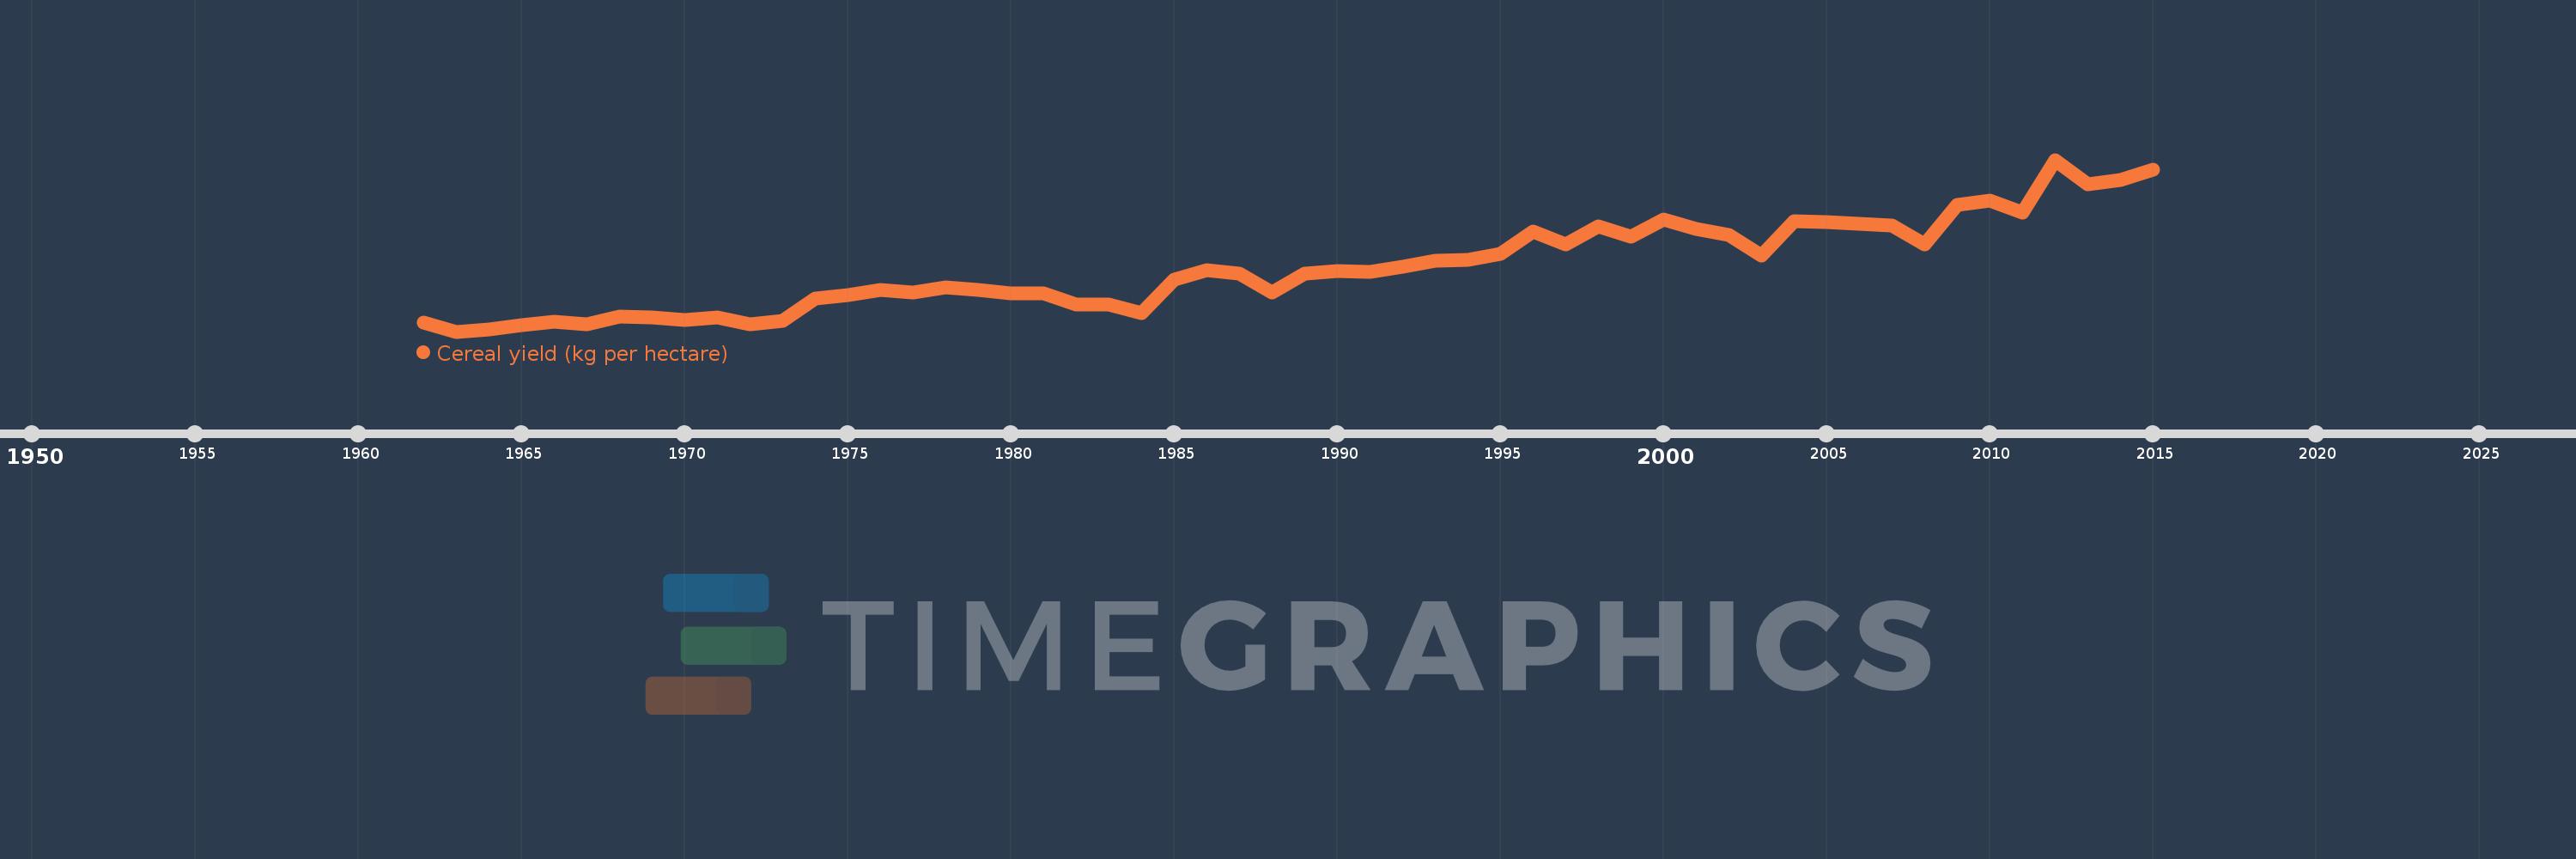
Cereal yield (kg per hectare)
2015,2014,2013,2012,2011,2010,2009,2008,2007,2006,2005,2004,2003,2002,2001,2000,1999,1998,1997,1996,1995,1994,1993,1992,1991,1990,1989,1988,1987,1986,1985,1984,1983,1982,1981,1980,1979,1978,1977,1976,1975,1974,1973,1972,1971,1970,1969,1968,1967,1966,1965,1964,1963,1962
This statistics in other country:
AfghanistanAlbaniaAlgeriaAngolaAntigua and BarbudaArab WorldArgentinaArmeniaAustraliaAustriaAzerbaijanBahamas, TheBangladeshBarbadosBelarusBelgiumBelizeBeninBhutanBoliviaBosnia and HerzegovinaBotswanaBrazilBrunei DarussalamBulgariaBurkina FasoBurundiCabo VerdeCambodiaCameroonCanadaCaribbean small statesCentral African RepublicCentral Europe and the BalticsChadChileChinaColombiaComorosCongo, Dem. Rep.Congo, Rep.Costa RicaCote d'IvoireCroatiaCubaCyprusCzech RepublicDenmarkDjiboutiDominicaDominican RepublicEarly-demographic dividendEast Asia & PacificEast Asia & Pacific (excluding high income)East Asia & Pacific (IDA & IBRD countries)EcuadorEgypt, Arab Rep.El SalvadorEritreaEstoniaEthiopiaEuro areaEurope & Central AsiaEurope & Central Asia (excluding high income)Europe & Central Asia (IDA & IBRD countries)European UnionFijiFinlandFragile and conflict affected situationsFranceGabonGambia, TheGeorgiaGermanyGhanaGreeceGrenadaGuamGuatemalaGuineaGuinea-BissauGuyanaHaitiHeavily indebted poor countries (HIPC)High incomeHondurasHong Kong SAR, ChinaHungaryIBRD onlyIDA & IBRD totalIDA blendIDA onlyIDA totalIndiaIndonesiaIran, Islamic Rep.IraqIrelandIsraelItalyJamaicaJapanJordanKazakhstanKenyaKorea, Dem. People’s Rep.Korea, Rep.KuwaitKyrgyz RepublicLao PDRLate-demographic dividendLatin America & Caribbean Latin America & Caribbean (excluding high income)Latin America & the Caribbean (IDA & IBRD countries)LatviaLeast developed countries: UN classificationLebanonLesothoLiberiaLibyaLithuaniaLow & middle incomeLow incomeLower middle incomeLuxembourgMacedonia, FYRMadagascarMalawiMalaysiaMaldivesMaliMaltaMauritaniaMauritiusMexicoMicronesia, Fed. Sts.Middle East & North AfricaMiddle East & North Africa (excluding high income)Middle East & North Africa (IDA & IBRD countries)Middle incomeMoldovaMongoliaMontenegroMoroccoMozambiqueMyanmarNamibiaNepalNetherlandsNew CaledoniaNew ZealandNicaraguaNigerNigeriaNorth AmericaNorwayOECD membersOmanOther small statesPacific island small statesPakistanPanamaPapua New GuineaParaguayPeruPhilippinesPolandPortugalPost-demographic dividendPre-demographic dividendPuerto RicoQatarRomaniaRussian FederationRwandaSao Tome and PrincipeSaudi ArabiaSenegalSerbiaSierra LeoneSlovak RepublicSloveniaSmall statesSolomon IslandsSomaliaSouth AfricaSouth AsiaSouth Asia (IDA & IBRD)South SudanSpainSri LankaSt. LuciaSt. Vincent and the GrenadinesSub-Saharan Africa Sub-Saharan Africa (excluding high income)Sub-Saharan Africa (IDA & IBRD countries)SudanSurinameSwazilandSwedenSwitzerlandSyrian Arab RepublicTajikistanTanzaniaThailandTimor-LesteTogoTrinidad and TobagoTunisiaTurkeyTurkmenistanUgandaUkraineUnited Arab EmiratesUnited KingdomUnited StatesUpper middle incomeUruguayUzbekistanVanuatuVenezuela, RBVietnamWest Bank and GazaWorldYemen, Rep.ZambiaZimbabwe Timeline:
This timeline shows a graph from 1962 to 2015 of Benin. No data until 1961. Number of actual observations by date: 54.
Source name:
World Development Indicators
Source organization:
Food and Agriculture Organization, electronic files and web site.
Categories, topics:
Agriculture & Rural Development, Climate Change
Last updated:
apr 23, 2017
Indicators value changes by year
Maximum:
1.518K
jan 1, 2012
At the date of observation
Value
Absolute change
Change from previous value
jan 1, 1962
546.1
+546.1
0.0%
jan 1, 1963
489.9
-56.2
-10.29%
jan 1, 1964
503.5
+13.6
2.78%
jan 1, 1965
529.3
+25.8
5.12%
jan 1, 1966
551.5
+22.2
4.19%
jan 1, 1967
531.8
-19.7
-3.57%
jan 1, 1968
577.5
+45.7
8.59%
jan 1, 1969
573.8
-3.7
-0.64%
jan 1, 1970
556.8
-17.0
-2.96%
jan 1, 1971
577.1
+20.3
3.65%
jan 1, 1972
532.7
-44.4
-7.69%
jan 1, 1973
555.8
+23.1
4.34%
jan 1, 1974
687.7
+131.9
23.73%
jan 1, 1975
707.9
+20.2
2.94%
jan 1, 1976
739.3
+31.4
4.44%
jan 1, 1977
724.6
-14.7
-1.99%
jan 1, 1978
754.0
+29.4
4.06%
jan 1, 1979
741.1
-12.9
-1.71%
jan 1, 1980
720.9
-20.2
-2.73%
jan 1, 1981
718.3
-2.6
-0.36%
jan 1, 1982
653.8
-64.5
-8.98%
jan 1, 1983
649.5
-4.3
-0.66%
jan 1, 1984
599.9
-49.6
-7.64%
jan 1, 1985
799.1
+199.2
33.21%
jan 1, 1986
855.8
+56.7
7.1%
jan 1, 1987
836.2
-19.6
-2.29%
jan 1, 1988
725.1
-111.1
-13.29%
jan 1, 1989
834.7
+109.6
15.12%
jan 1, 1990
853.7
+19.0
2.28%
jan 1, 1991
847.9
-5.8
-0.68%
jan 1, 1992
878.6
+30.7
3.62%
jan 1, 1993
913.4
+34.8
3.96%
jan 1, 1994
919.2
+5.8
0.63%
jan 1, 1995
956.9
+37.7
4.1%
jan 1, 1996
1.087K
+129.6
13.54%
jan 1, 1997
1.01K
-76.9
-7.08%
jan 1, 1998
1.117K
+107.4
10.64%
jan 1, 1999
1.056K
-61.1
-5.47%
jan 1, 2000
1.163K
+106.7
10.11%
jan 1, 2001
1.102K
-60.5
-5.2%
jan 1, 2002
1.069K
-32.8
-2.98%
jan 1, 2003
945.1
-124.2
-11.62%
jan 1, 2004
1.149K
+203.6
21.54%
jan 1, 2005
1.147K
-2.1
-0.18%
jan 1, 2006
1.136K
-10.2
-0.89%
jan 1, 2007
1.126K
-10.7
-0.94%
jan 1, 2008
1.014K
-112.1
-9.96%
jan 1, 2009
1.248K
+234.4
23.13%
jan 1, 2010
1.271K
+23.2
1.86%
jan 1, 2011
1.201K
-70.6
-5.55%
jan 1, 2012
1.518K
+317.2
26.42%
jan 1, 2013
1.373K
-144.6
-9.53%
jan 1, 2014
1.399K
+26.1
1.9%
jan 1, 2015
1.46K
+61.0
4.36%
Ranking of countries by current statistics by years


Comments: