29
/
en
AIzaSyAYiBZKx7MnpbEhh9jyipgxe19OcubqV5w
April 1, 2024
53953
Pacific island small states
PSS
false
2
1
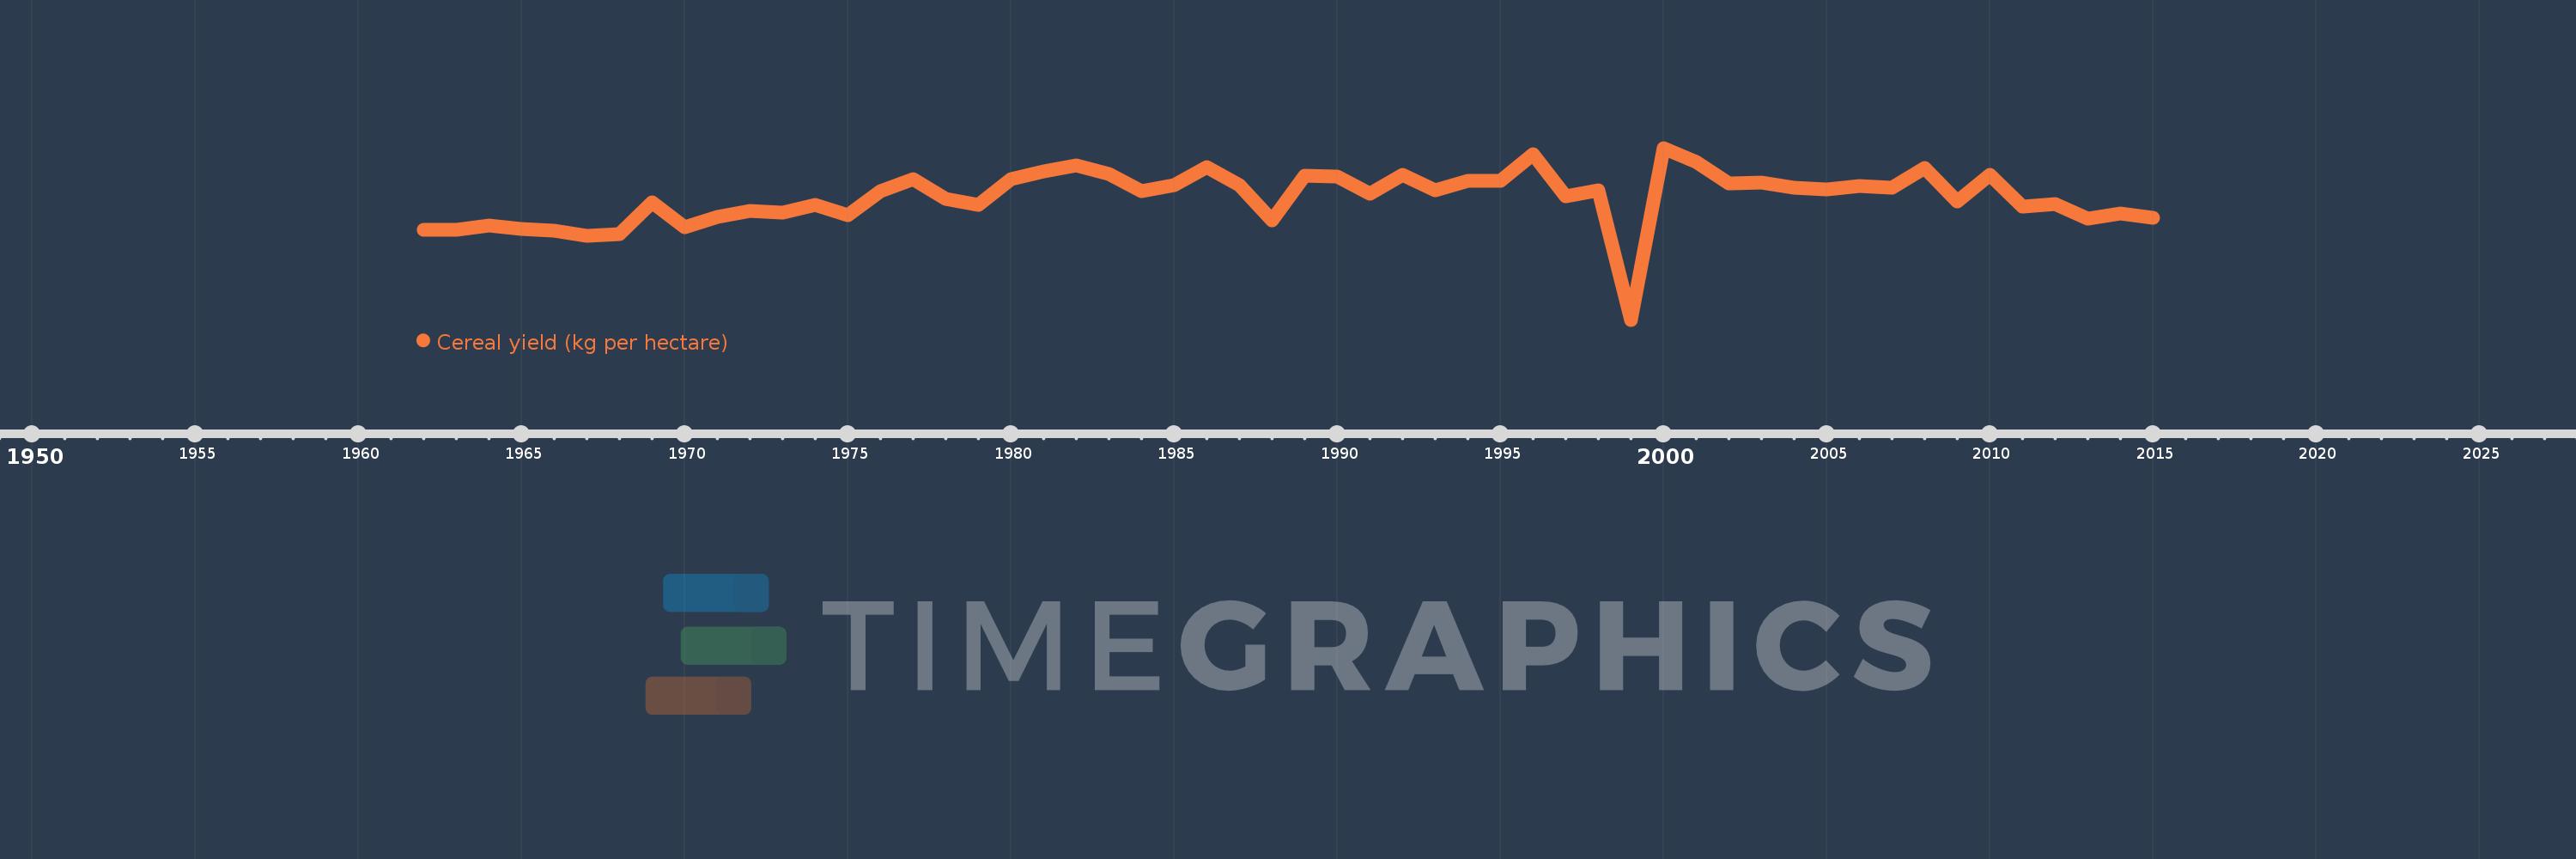
Cereal yield (kg per hectare)
2015,2014,2013,2012,2011,2010,2009,2008,2007,2006,2005,2004,2003,2002,2001,2000,1999,1998,1997,1996,1995,1994,1993,1992,1991,1990,1989,1988,1987,1986,1985,1984,1983,1982,1981,1980,1979,1978,1977,1976,1975,1974,1973,1972,1971,1970,1969,1968,1967,1966,1965,1964,1963,1962
This statistics in other country:
AfghanistanAlbaniaAlgeriaAngolaAntigua and BarbudaArab WorldArgentinaArmeniaAustraliaAustriaAzerbaijanBahamas, TheBangladeshBarbadosBelarusBelgiumBelizeBeninBhutanBoliviaBosnia and HerzegovinaBotswanaBrazilBrunei DarussalamBulgariaBurkina FasoBurundiCabo VerdeCambodiaCameroonCanadaCaribbean small statesCentral African RepublicCentral Europe and the BalticsChadChileChinaColombiaComorosCongo, Dem. Rep.Congo, Rep.Costa RicaCote d'IvoireCroatiaCubaCyprusCzech RepublicDenmarkDjiboutiDominicaDominican RepublicEarly-demographic dividendEast Asia & PacificEast Asia & Pacific (excluding high income)East Asia & Pacific (IDA & IBRD countries)EcuadorEgypt, Arab Rep.El SalvadorEritreaEstoniaEthiopiaEuro areaEurope & Central AsiaEurope & Central Asia (excluding high income)Europe & Central Asia (IDA & IBRD countries)European UnionFijiFinlandFragile and conflict affected situationsFranceGabonGambia, TheGeorgiaGermanyGhanaGreeceGrenadaGuamGuatemalaGuineaGuinea-BissauGuyanaHaitiHeavily indebted poor countries (HIPC)High incomeHondurasHong Kong SAR, ChinaHungaryIBRD onlyIDA & IBRD totalIDA blendIDA onlyIDA totalIndiaIndonesiaIran, Islamic Rep.IraqIrelandIsraelItalyJamaicaJapanJordanKazakhstanKenyaKorea, Dem. People’s Rep.Korea, Rep.KuwaitKyrgyz RepublicLao PDRLate-demographic dividendLatin America & Caribbean Latin America & Caribbean (excluding high income)Latin America & the Caribbean (IDA & IBRD countries)LatviaLeast developed countries: UN classificationLebanonLesothoLiberiaLibyaLithuaniaLow & middle incomeLow incomeLower middle incomeLuxembourgMacedonia, FYRMadagascarMalawiMalaysiaMaldivesMaliMaltaMauritaniaMauritiusMexicoMicronesia, Fed. Sts.Middle East & North AfricaMiddle East & North Africa (excluding high income)Middle East & North Africa (IDA & IBRD countries)Middle incomeMoldovaMongoliaMontenegroMoroccoMozambiqueMyanmarNamibiaNepalNetherlandsNew CaledoniaNew ZealandNicaraguaNigerNigeriaNorth AmericaNorwayOECD membersOmanOther small statesPacific island small statesPakistanPanamaPapua New GuineaParaguayPeruPhilippinesPolandPortugalPost-demographic dividendPre-demographic dividendPuerto RicoQatarRomaniaRussian FederationRwandaSao Tome and PrincipeSaudi ArabiaSenegalSerbiaSierra LeoneSlovak RepublicSloveniaSmall statesSolomon IslandsSomaliaSouth AfricaSouth AsiaSouth Asia (IDA & IBRD)South SudanSpainSri LankaSt. LuciaSt. Vincent and the GrenadinesSub-Saharan Africa Sub-Saharan Africa (excluding high income)Sub-Saharan Africa (IDA & IBRD countries)SudanSurinameSwazilandSwedenSwitzerlandSyrian Arab RepublicTajikistanTanzaniaThailandTimor-LesteTogoTrinidad and TobagoTunisiaTurkeyTurkmenistanUgandaUkraineUnited Arab EmiratesUnited KingdomUnited StatesUpper middle incomeUruguayUzbekistanVanuatuVenezuela, RBVietnamWest Bank and GazaWorldYemen, Rep.ZambiaZimbabwe Timeline:
This timeline shows a graph from 1962 to 2015 of Pacific island small states. No data until 1961. Number of actual observations by date: 54.
Source name:
World Development Indicators
Source organization:
Food and Agriculture Organization, electronic files and web site.
Categories, topics:
Agriculture & Rural Development, Climate Change
Last updated:
apr 23, 2017
Indicators value changes by year
Minimum:
830.496
jan 1, 1999
At the date of observation
Value
Absolute change
Change from previous value
jan 1, 1962
1.697K
+1.697K
0.0%
jan 1, 1963
1.701K
+3.749
0.22%
jan 1, 1964
1.743K
+41.536
2.44%
jan 1, 1965
1.707K
-35.382
-2.03%
jan 1, 1966
1.689K
-18.343
-1.07%
jan 1, 1967
1.64K
-48.819
-2.89%
jan 1, 1968
1.658K
+17.548
1.07%
jan 1, 1969
1.962K
+304.181
18.35%
jan 1, 1970
1.72K
-241.796
-12.33%
jan 1, 1971
1.825K
+105.186
6.12%
jan 1, 1972
1.879K
+53.852
2.95%
jan 1, 1973
1.864K
-14.757
-0.79%
jan 1, 1974
1.943K
+78.449
4.21%
jan 1, 1975
1.843K
-99.464
-5.12%
jan 1, 1976
2.074K
+230.53
12.51%
jan 1, 1977
2.192K
+117.879
5.68%
jan 1, 1978
1.994K
-197.95
-9.03%
jan 1, 1979
1.938K
-55.665
-2.79%
jan 1, 1980
2.185K
+247.121
12.75%
jan 1, 1981
2.264K
+78.581
3.6%
jan 1, 1982
2.322K
+58.687
2.59%
jan 1, 1983
2.241K
-81.306
-3.5%
jan 1, 1984
2.073K
-168.352
-7.51%
jan 1, 1985
2.132K
+59.461
2.87%
jan 1, 1986
2.301K
+168.954
7.92%
jan 1, 1987
2.131K
-170.657
-7.42%
jan 1, 1988
1.791K
-339.543
-15.94%
jan 1, 1989
2.22K
+428.975
23.95%
jan 1, 1990
2.21K
-10.146
-0.46%
jan 1, 1991
2.05K
-160.079
-7.24%
jan 1, 1992
2.229K
+179.727
8.77%
jan 1, 1993
2.078K
-151.684
-6.8%
jan 1, 1994
2.172K
+94.558
4.55%
jan 1, 1995
2.17K
-2.127
-0.1%
jan 1, 1996
2.428K
+257.447
11.86%
jan 1, 1997
2.018K
-409.231
-16.86%
jan 1, 1998
2.083K
+64.66
3.2%
jan 1, 1999
830.496
-1.253K
-60.13%
jan 1, 2000
2.49K
+1.659K
199.77%
jan 1, 2001
2.355K
-134.598
-5.41%
jan 1, 2002
2.144K
-210.669
-8.95%
jan 1, 2003
2.153K
+8.405
0.39%
jan 1, 2004
2.102K
-50.625
-2.35%
jan 1, 2005
2.089K
-13.526
-0.64%
jan 1, 2006
2.123K
+34.799
1.67%
jan 1, 2007
2.101K
-21.891
-1.03%
jan 1, 2008
2.298K
+196.635
9.36%
jan 1, 2009
1.971K
-326.866
-14.22%
jan 1, 2010
2.231K
+260.086
13.19%
jan 1, 2011
1.923K
-307.961
-13.8%
jan 1, 2012
1.946K
+22.751
1.18%
jan 1, 2013
1.809K
-137.557
-7.07%
jan 1, 2014
1.856K
+47.086
2.6%
jan 1, 2015
1.817K
-38.968
-2.1%
Ranking of countries by current statistics by years


Comments: