29
/
en
AIzaSyAYiBZKx7MnpbEhh9jyipgxe19OcubqV5w
April 1, 2024
179787
Libya
LBY
true
2
1
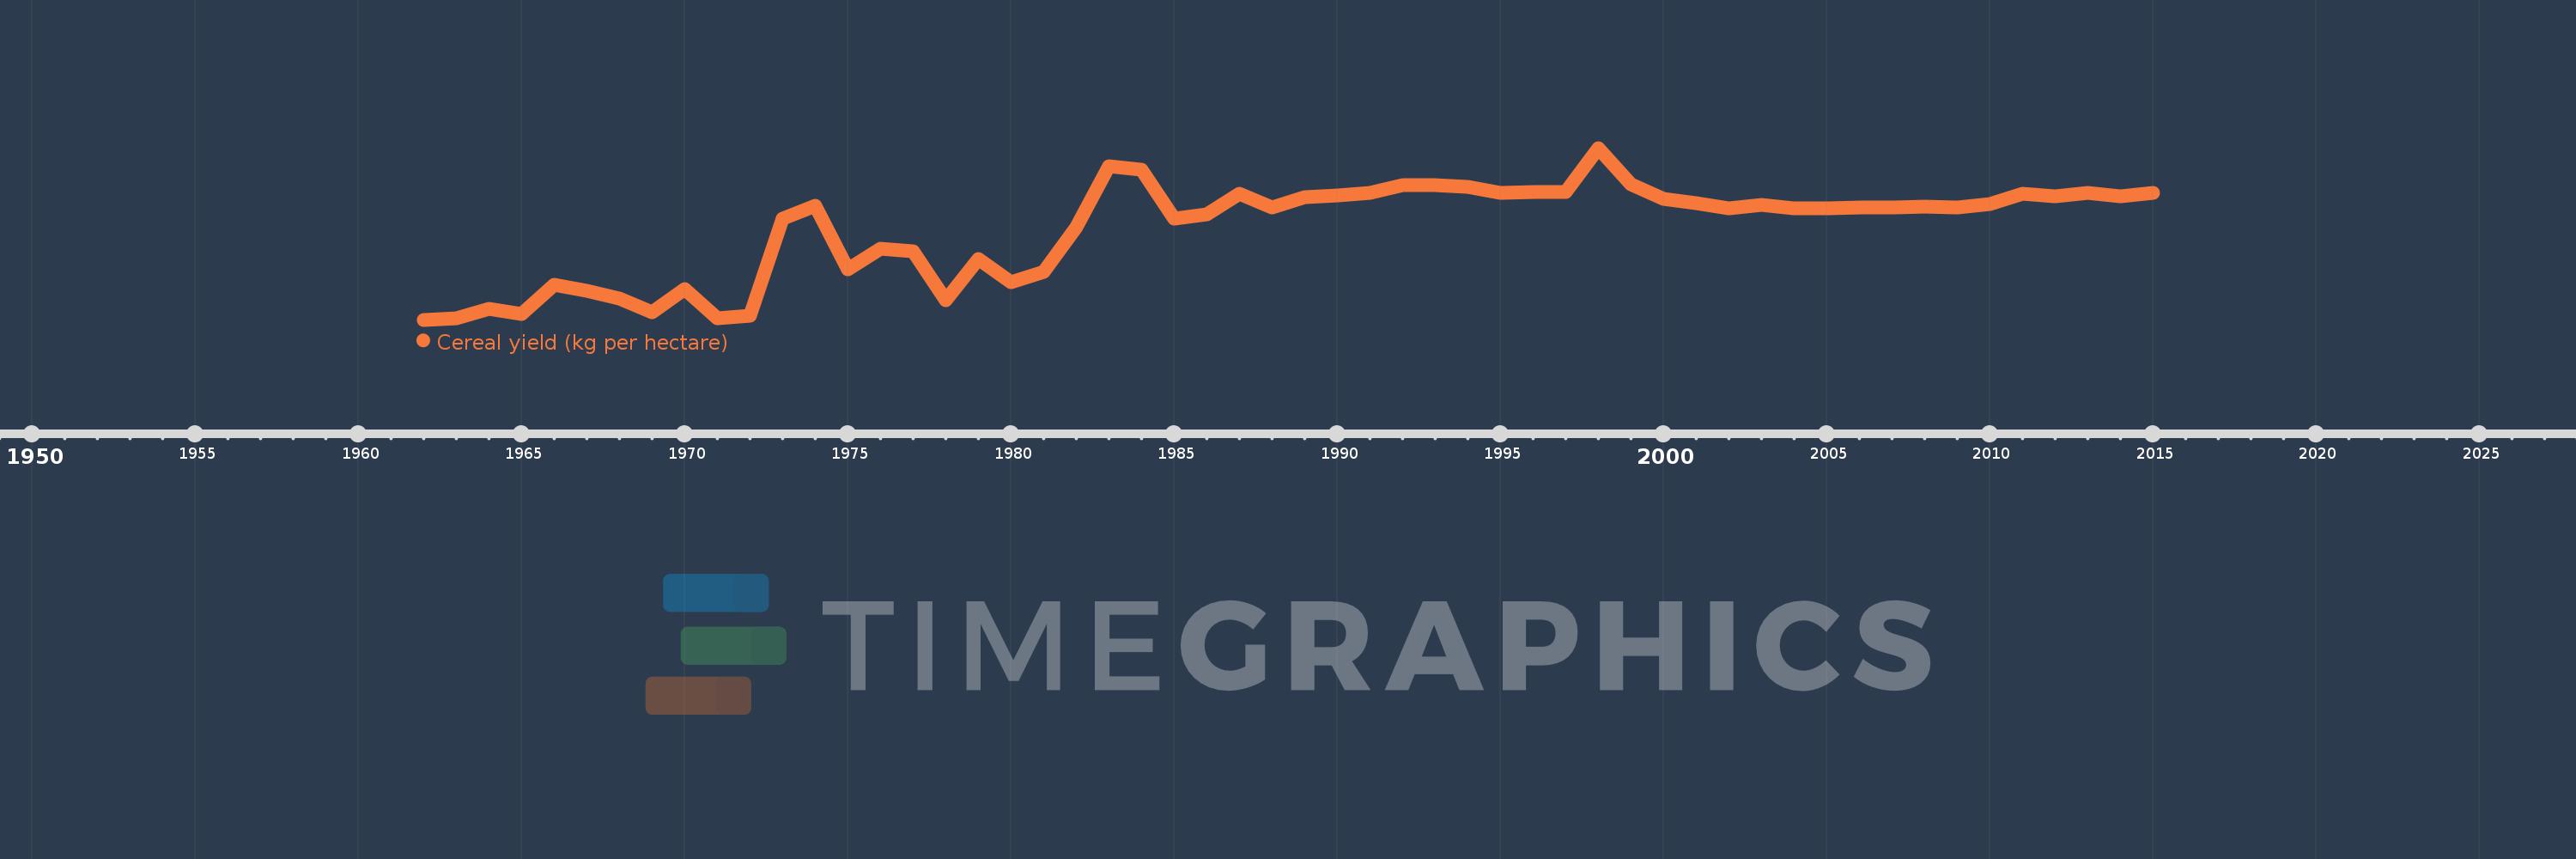
Cereal yield (kg per hectare)
2015,2014,2013,2012,2011,2010,2009,2008,2007,2006,2005,2004,2003,2002,2001,2000,1999,1998,1997,1996,1995,1994,1993,1992,1991,1990,1989,1988,1987,1986,1985,1984,1983,1982,1981,1980,1979,1978,1977,1976,1975,1974,1973,1972,1971,1970,1969,1968,1967,1966,1965,1964,1963,1962
This statistics in other country:
AfghanistanAlbaniaAlgeriaAngolaAntigua and BarbudaArab WorldArgentinaArmeniaAustraliaAustriaAzerbaijanBahamas, TheBangladeshBarbadosBelarusBelgiumBelizeBeninBhutanBoliviaBosnia and HerzegovinaBotswanaBrazilBrunei DarussalamBulgariaBurkina FasoBurundiCabo VerdeCambodiaCameroonCanadaCaribbean small statesCentral African RepublicCentral Europe and the BalticsChadChileChinaColombiaComorosCongo, Dem. Rep.Congo, Rep.Costa RicaCote d'IvoireCroatiaCubaCyprusCzech RepublicDenmarkDjiboutiDominicaDominican RepublicEarly-demographic dividendEast Asia & PacificEast Asia & Pacific (excluding high income)East Asia & Pacific (IDA & IBRD countries)EcuadorEgypt, Arab Rep.El SalvadorEritreaEstoniaEthiopiaEuro areaEurope & Central AsiaEurope & Central Asia (excluding high income)Europe & Central Asia (IDA & IBRD countries)European UnionFijiFinlandFragile and conflict affected situationsFranceGabonGambia, TheGeorgiaGermanyGhanaGreeceGrenadaGuamGuatemalaGuineaGuinea-BissauGuyanaHaitiHeavily indebted poor countries (HIPC)High incomeHondurasHong Kong SAR, ChinaHungaryIBRD onlyIDA & IBRD totalIDA blendIDA onlyIDA totalIndiaIndonesiaIran, Islamic Rep.IraqIrelandIsraelItalyJamaicaJapanJordanKazakhstanKenyaKorea, Dem. People’s Rep.Korea, Rep.KuwaitKyrgyz RepublicLao PDRLate-demographic dividendLatin America & Caribbean Latin America & Caribbean (excluding high income)Latin America & the Caribbean (IDA & IBRD countries)LatviaLeast developed countries: UN classificationLebanonLesothoLiberiaLibyaLithuaniaLow & middle incomeLow incomeLower middle incomeLuxembourgMacedonia, FYRMadagascarMalawiMalaysiaMaldivesMaliMaltaMauritaniaMauritiusMexicoMicronesia, Fed. Sts.Middle East & North AfricaMiddle East & North Africa (excluding high income)Middle East & North Africa (IDA & IBRD countries)Middle incomeMoldovaMongoliaMontenegroMoroccoMozambiqueMyanmarNamibiaNepalNetherlandsNew CaledoniaNew ZealandNicaraguaNigerNigeriaNorth AmericaNorwayOECD membersOmanOther small statesPacific island small statesPakistanPanamaPapua New GuineaParaguayPeruPhilippinesPolandPortugalPost-demographic dividendPre-demographic dividendPuerto RicoQatarRomaniaRussian FederationRwandaSao Tome and PrincipeSaudi ArabiaSenegalSerbiaSierra LeoneSlovak RepublicSloveniaSmall statesSolomon IslandsSomaliaSouth AfricaSouth AsiaSouth Asia (IDA & IBRD)South SudanSpainSri LankaSt. LuciaSt. Vincent and the GrenadinesSub-Saharan Africa Sub-Saharan Africa (excluding high income)Sub-Saharan Africa (IDA & IBRD countries)SudanSurinameSwazilandSwedenSwitzerlandSyrian Arab RepublicTajikistanTanzaniaThailandTimor-LesteTogoTrinidad and TobagoTunisiaTurkeyTurkmenistanUgandaUkraineUnited Arab EmiratesUnited KingdomUnited StatesUpper middle incomeUruguayUzbekistanVanuatuVenezuela, RBVietnamWest Bank and GazaWorldYemen, Rep.ZambiaZimbabwe Timeline:
This timeline shows a graph from 1962 to 2015 of Libya. No data until 1961. Number of actual observations by date: 54.
Source name:
World Development Indicators
Source organization:
Food and Agriculture Organization, electronic files and web site.
Categories, topics:
Agriculture & Rural Development, Climate Change
Last updated:
apr 23, 2017
Indicators value changes by year
At the date of observation
Value
Absolute change
Change from previous value
jan 1, 1962
214.7
+214.7
0.0%
jan 1, 1963
221.0
+6.3
2.93%
jan 1, 1964
255.3
+34.3
15.52%
jan 1, 1965
235.0
-20.3
-7.95%
jan 1, 1966
341.9
+106.9
45.49%
jan 1, 1967
319.9
-22.0
-6.43%
jan 1, 1968
292.4
-27.5
-8.6%
jan 1, 1969
242.3
-50.1
-17.13%
jan 1, 1970
326.0
+83.7
34.54%
jan 1, 1971
219.6
-106.4
-32.64%
jan 1, 1972
229.8
+10.2
4.64%
jan 1, 1973
581.1
+351.3
152.87%
jan 1, 1974
627.1
+46.0
7.92%
jan 1, 1975
398.0
-229.1
-36.53%
jan 1, 1976
472.4
+74.4
18.69%
jan 1, 1977
463.0
-9.4
-1.99%
jan 1, 1978
286.8
-176.2
-38.06%
jan 1, 1979
435.4
+148.6
51.81%
jan 1, 1980
351.7
-83.7
-19.22%
jan 1, 1981
386.9
+35.2
10.01%
jan 1, 1982
550.2
+163.3
42.21%
jan 1, 1983
769.6
+219.4
39.88%
jan 1, 1984
756.9
-12.7
-1.65%
jan 1, 1985
579.9
-177.0
-23.38%
jan 1, 1986
595.0
+15.1
2.6%
jan 1, 1987
672.1
+77.1
12.96%
jan 1, 1988
620.8
-51.3
-7.63%
jan 1, 1989
659.9
+39.1
6.3%
jan 1, 1990
665.7
+5.8
0.88%
jan 1, 1991
674.5
+8.8
1.32%
jan 1, 1992
700.9
+26.4
3.91%
jan 1, 1993
702.3
+1.4
0.2%
jan 1, 1994
696.2
-6.1
-0.87%
jan 1, 1995
675.7
-20.5
-2.94%
jan 1, 1996
678.5
+2.8
0.41%
jan 1, 1997
678.0
-0.5
-0.07%
jan 1, 1998
836.9
+158.9
23.44%
jan 1, 1999
705.7
-131.2
-15.68%
jan 1, 2000
652.1
-53.6
-7.6%
jan 1, 2001
637.1
-15.0
-2.3%
jan 1, 2002
619.0
-18.1
-2.84%
jan 1, 2003
631.3
+12.3
1.99%
jan 1, 2004
619.3
-12.0
-1.9%
jan 1, 2005
619.3
0.0
0.0%
jan 1, 2006
622.8
+3.5
0.57%
jan 1, 2007
622.6
-0.2
-0.03%
jan 1, 2008
623.0
+0.4
0.06%
jan 1, 2009
621.7
-1.3
-0.21%
jan 1, 2010
634.1
+12.4
1.99%
jan 1, 2011
669.7
+35.6
5.61%
jan 1, 2012
661.2
-8.5
-1.27%
jan 1, 2013
675.5
+14.3
2.16%
jan 1, 2014
661.7
-13.8
-2.04%
jan 1, 2015
672.8
+11.1
1.68%
Ranking of countries by current statistics by years


Comments: