29
/
en
AIzaSyAYiBZKx7MnpbEhh9jyipgxe19OcubqV5w
April 1, 2024
160267
Israel
ISR
true
2
1
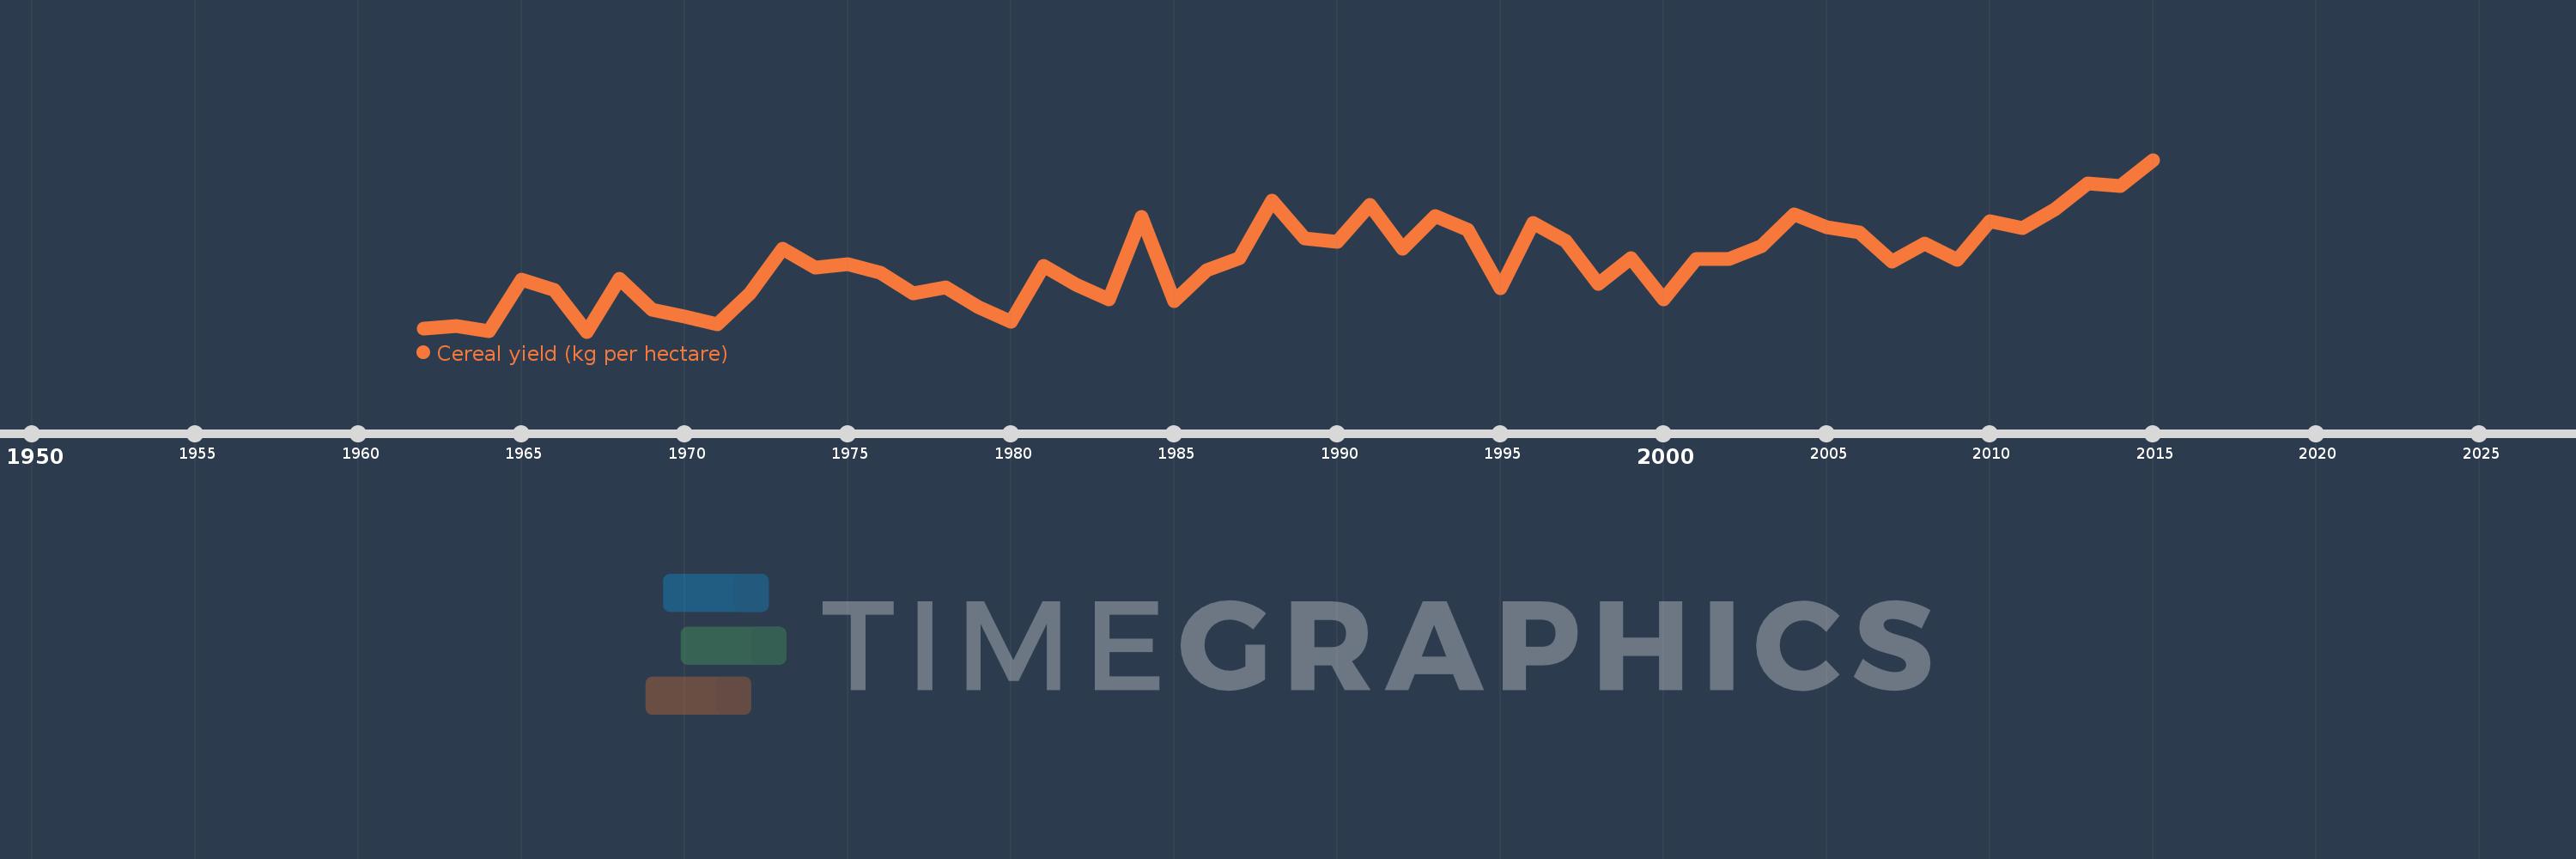
Cereal yield (kg per hectare)
2015,2014,2013,2012,2011,2010,2009,2008,2007,2006,2005,2004,2003,2002,2001,2000,1999,1998,1997,1996,1995,1994,1993,1992,1991,1990,1989,1988,1987,1986,1985,1984,1983,1982,1981,1980,1979,1978,1977,1976,1975,1974,1973,1972,1971,1970,1969,1968,1967,1966,1965,1964,1963,1962
This statistics in other country:
AfghanistanAlbaniaAlgeriaAngolaAntigua and BarbudaArab WorldArgentinaArmeniaAustraliaAustriaAzerbaijanBahamas, TheBangladeshBarbadosBelarusBelgiumBelizeBeninBhutanBoliviaBosnia and HerzegovinaBotswanaBrazilBrunei DarussalamBulgariaBurkina FasoBurundiCabo VerdeCambodiaCameroonCanadaCaribbean small statesCentral African RepublicCentral Europe and the BalticsChadChileChinaColombiaComorosCongo, Dem. Rep.Congo, Rep.Costa RicaCote d'IvoireCroatiaCubaCyprusCzech RepublicDenmarkDjiboutiDominicaDominican RepublicEarly-demographic dividendEast Asia & PacificEast Asia & Pacific (excluding high income)East Asia & Pacific (IDA & IBRD countries)EcuadorEgypt, Arab Rep.El SalvadorEritreaEstoniaEthiopiaEuro areaEurope & Central AsiaEurope & Central Asia (excluding high income)Europe & Central Asia (IDA & IBRD countries)European UnionFijiFinlandFragile and conflict affected situationsFranceGabonGambia, TheGeorgiaGermanyGhanaGreeceGrenadaGuamGuatemalaGuineaGuinea-BissauGuyanaHaitiHeavily indebted poor countries (HIPC)High incomeHondurasHong Kong SAR, ChinaHungaryIBRD onlyIDA & IBRD totalIDA blendIDA onlyIDA totalIndiaIndonesiaIran, Islamic Rep.IraqIrelandIsraelItalyJamaicaJapanJordanKazakhstanKenyaKorea, Dem. People’s Rep.Korea, Rep.KuwaitKyrgyz RepublicLao PDRLate-demographic dividendLatin America & Caribbean Latin America & Caribbean (excluding high income)Latin America & the Caribbean (IDA & IBRD countries)LatviaLeast developed countries: UN classificationLebanonLesothoLiberiaLibyaLithuaniaLow & middle incomeLow incomeLower middle incomeLuxembourgMacedonia, FYRMadagascarMalawiMalaysiaMaldivesMaliMaltaMauritaniaMauritiusMexicoMicronesia, Fed. Sts.Middle East & North AfricaMiddle East & North Africa (excluding high income)Middle East & North Africa (IDA & IBRD countries)Middle incomeMoldovaMongoliaMontenegroMoroccoMozambiqueMyanmarNamibiaNepalNetherlandsNew CaledoniaNew ZealandNicaraguaNigerNigeriaNorth AmericaNorwayOECD membersOmanOther small statesPacific island small statesPakistanPanamaPapua New GuineaParaguayPeruPhilippinesPolandPortugalPost-demographic dividendPre-demographic dividendPuerto RicoQatarRomaniaRussian FederationRwandaSao Tome and PrincipeSaudi ArabiaSenegalSerbiaSierra LeoneSlovak RepublicSloveniaSmall statesSolomon IslandsSomaliaSouth AfricaSouth AsiaSouth Asia (IDA & IBRD)South SudanSpainSri LankaSt. LuciaSt. Vincent and the GrenadinesSub-Saharan Africa Sub-Saharan Africa (excluding high income)Sub-Saharan Africa (IDA & IBRD countries)SudanSurinameSwazilandSwedenSwitzerlandSyrian Arab RepublicTajikistanTanzaniaThailandTimor-LesteTogoTrinidad and TobagoTunisiaTurkeyTurkmenistanUgandaUkraineUnited Arab EmiratesUnited KingdomUnited StatesUpper middle incomeUruguayUzbekistanVanuatuVenezuela, RBVietnamWest Bank and GazaWorldYemen, Rep.ZambiaZimbabwe Timeline:
This timeline shows a graph from 1962 to 2015 of Israel. No data until 1961. Number of actual observations by date: 54.
Source name:
World Development Indicators
Source organization:
Food and Agriculture Organization, electronic files and web site.
Categories, topics:
Agriculture & Rural Development, Climate Change
Last updated:
apr 23, 2017
Indicators value changes by year
Minimum:
1.053K
jan 1, 1967
Maximum:
4.356K
jan 1, 2015
At the date of observation
Value
Absolute change
Change from previous value
jan 1, 1962
1.108K
+1.108K
0.0%
jan 1, 1963
1.16K
+52.1
4.7%
jan 1, 1964
1.056K
-103.6
-8.93%
jan 1, 1965
2.044K
+987.9
93.51%
jan 1, 1966
1.853K
-191.6
-9.37%
jan 1, 1967
1.053K
-800.1
-43.18%
jan 1, 1968
2.061K
+1.008K
95.76%
jan 1, 1969
1.481K
-579.5
-28.12%
jan 1, 1970
1.348K
-132.9
-8.97%
jan 1, 1971
1.186K
-162.1
-12.02%
jan 1, 1972
1.792K
+605.3
51.02%
jan 1, 1973
2.643K
+850.9
47.49%
jan 1, 1974
2.278K
-364.5
-13.79%
jan 1, 1975
2.354K
+75.8
3.33%
jan 1, 1976
2.18K
-174.1
-7.4%
jan 1, 1977
1.791K
-388.9
-17.84%
jan 1, 1978
1.911K
+120.4
6.72%
jan 1, 1979
1.53K
-381.2
-19.95%
jan 1, 1980
1.25K
-280.3
-18.32%
jan 1, 1981
2.317K
+1.067K
85.37%
jan 1, 1982
1.955K
-361.9
-15.62%
jan 1, 1983
1.669K
-285.2
-14.59%
jan 1, 1984
3.261K
+1.592K
95.34%
jan 1, 1985
1.639K
-1.622K
-49.75%
jan 1, 1986
2.24K
+601.6
36.71%
jan 1, 1987
2.46K
+219.5
9.8%
jan 1, 1988
3.567K
+1.107K
44.99%
jan 1, 1989
2.847K
-720.1
-20.19%
jan 1, 1990
2.776K
-70.1
-2.46%
jan 1, 1991
3.486K
+709.5
25.55%
jan 1, 1992
2.644K
-841.9
-24.15%
jan 1, 1993
3.267K
+622.8
23.55%
jan 1, 1994
3.015K
-252.0
-7.71%
jan 1, 1995
1.886K
-1.129K
-37.46%
jan 1, 1996
3.134K
+1.248K
66.19%
jan 1, 1997
2.797K
-336.7
-10.74%
jan 1, 1998
1.969K
-827.8
-29.6%
jan 1, 1999
2.47K
+500.9
25.44%
jan 1, 2000
1.668K
-801.7
-32.46%
jan 1, 2001
2.443K
+774.9
46.45%
jan 1, 2002
2.456K
+12.3
0.5%
jan 1, 2003
2.69K
+234.4
9.55%
jan 1, 2004
3.307K
+616.5
22.92%
jan 1, 2005
3.067K
-239.8
-7.25%
jan 1, 2006
2.952K
-114.7
-3.74%
jan 1, 2007
2.398K
-553.5
-18.75%
jan 1, 2008
2.753K
+354.1
14.76%
jan 1, 2009
2.439K
-313.1
-11.37%
jan 1, 2010
3.175K
+735.6
30.15%
jan 1, 2011
3.037K
-138.4
-4.36%
jan 1, 2012
3.401K
+364.0
11.99%
jan 1, 2013
3.899K
+498.2
14.65%
jan 1, 2014
3.846K
-53.0
-1.36%
jan 1, 2015
4.356K
+509.9
13.26%
Ranking of countries by current statistics by years


Comments: