29
/
en
AIzaSyAYiBZKx7MnpbEhh9jyipgxe19OcubqV5w
April 1, 2024
31364
Europe & Central Asia (excluding high income)
ECA
false
2
1
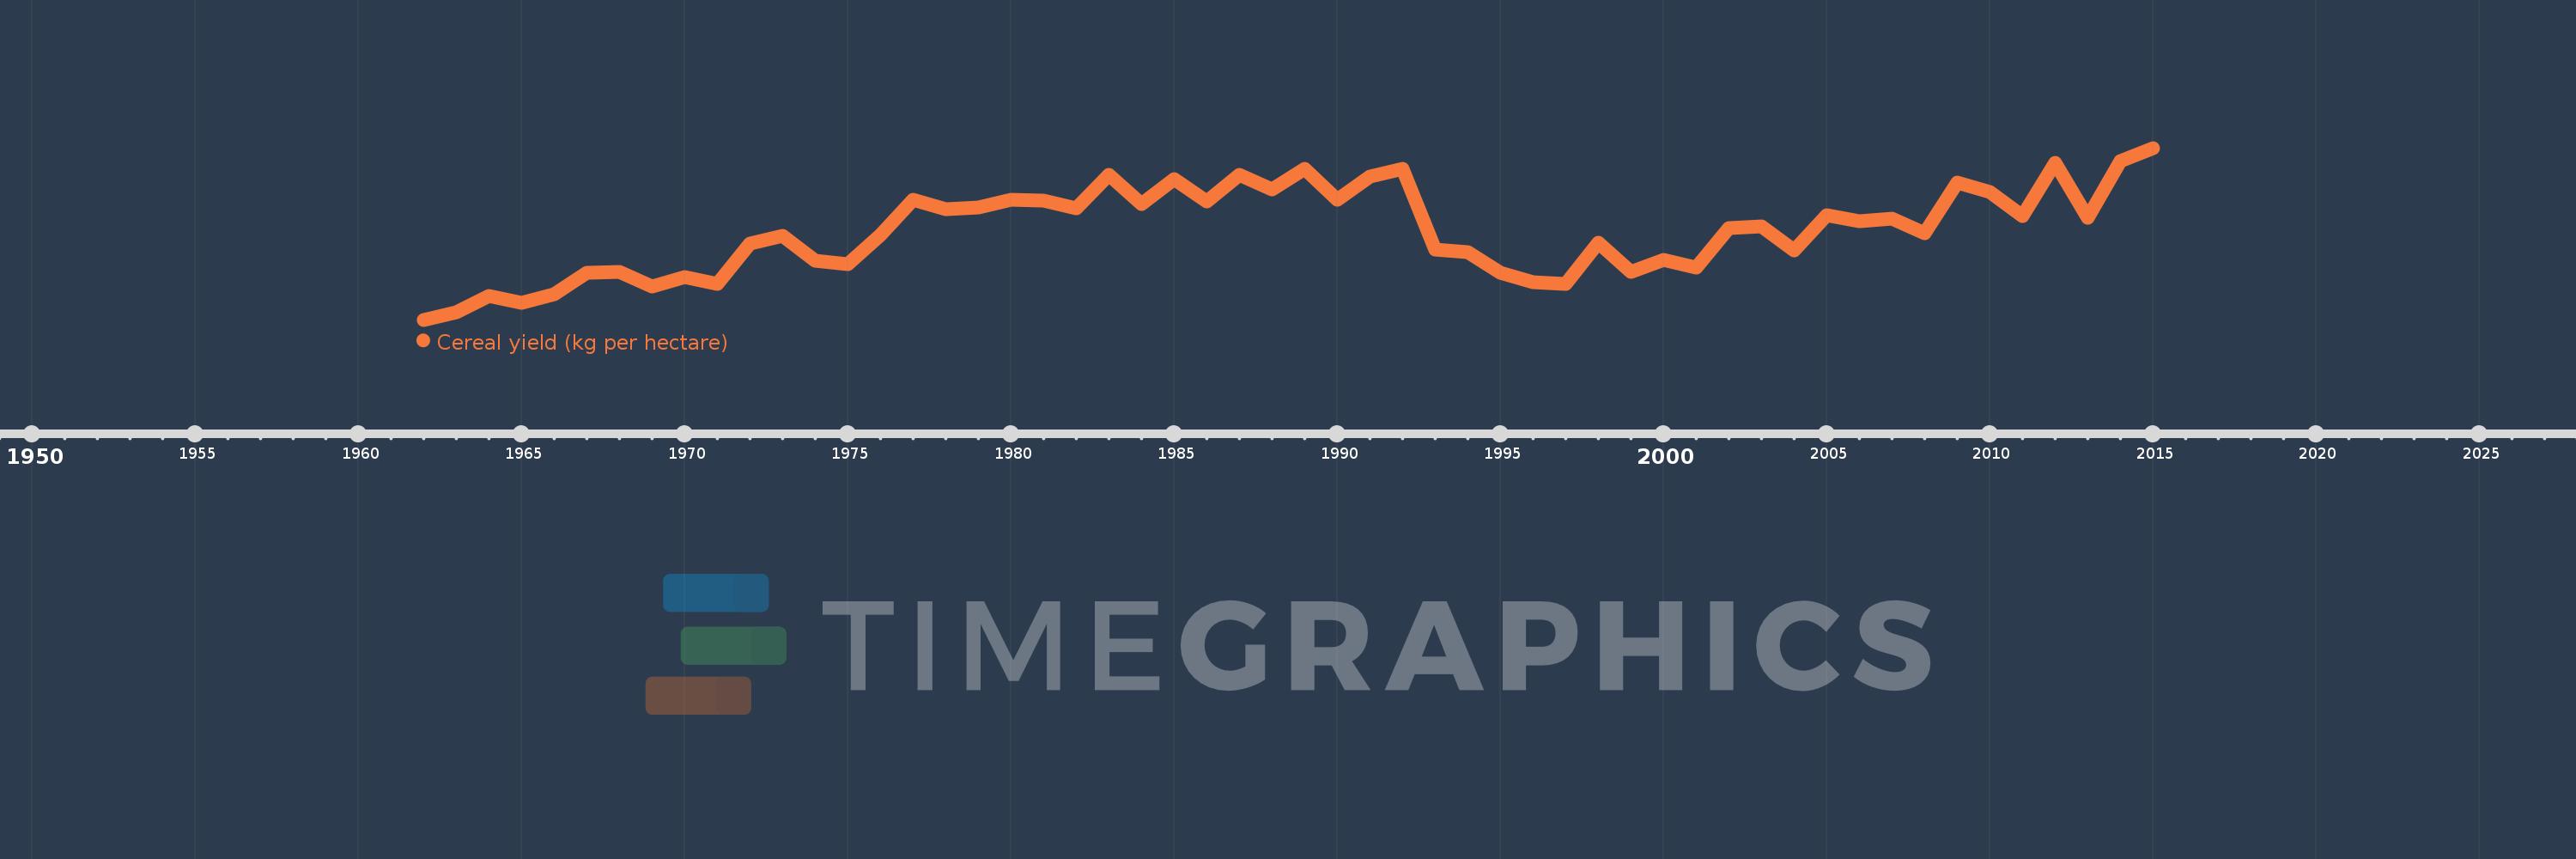
Cereal yield (kg per hectare)
2015,2014,2013,2012,2011,2010,2009,2008,2007,2006,2005,2004,2003,2002,2001,2000,1999,1998,1997,1996,1995,1994,1993,1992,1991,1990,1989,1988,1987,1986,1985,1984,1983,1982,1981,1980,1979,1978,1977,1976,1975,1974,1973,1972,1971,1970,1969,1968,1967,1966,1965,1964,1963,1962
This statistics in other country:
AfghanistanAlbaniaAlgeriaAngolaAntigua and BarbudaArab WorldArgentinaArmeniaAustraliaAustriaAzerbaijanBahamas, TheBangladeshBarbadosBelarusBelgiumBelizeBeninBhutanBoliviaBosnia and HerzegovinaBotswanaBrazilBrunei DarussalamBulgariaBurkina FasoBurundiCabo VerdeCambodiaCameroonCanadaCaribbean small statesCentral African RepublicCentral Europe and the BalticsChadChileChinaColombiaComorosCongo, Dem. Rep.Congo, Rep.Costa RicaCote d'IvoireCroatiaCubaCyprusCzech RepublicDenmarkDjiboutiDominicaDominican RepublicEarly-demographic dividendEast Asia & PacificEast Asia & Pacific (excluding high income)East Asia & Pacific (IDA & IBRD countries)EcuadorEgypt, Arab Rep.El SalvadorEritreaEstoniaEthiopiaEuro areaEurope & Central AsiaEurope & Central Asia (excluding high income)Europe & Central Asia (IDA & IBRD countries)European UnionFijiFinlandFragile and conflict affected situationsFranceGabonGambia, TheGeorgiaGermanyGhanaGreeceGrenadaGuamGuatemalaGuineaGuinea-BissauGuyanaHaitiHeavily indebted poor countries (HIPC)High incomeHondurasHong Kong SAR, ChinaHungaryIBRD onlyIDA & IBRD totalIDA blendIDA onlyIDA totalIndiaIndonesiaIran, Islamic Rep.IraqIrelandIsraelItalyJamaicaJapanJordanKazakhstanKenyaKorea, Dem. People’s Rep.Korea, Rep.KuwaitKyrgyz RepublicLao PDRLate-demographic dividendLatin America & Caribbean Latin America & Caribbean (excluding high income)Latin America & the Caribbean (IDA & IBRD countries)LatviaLeast developed countries: UN classificationLebanonLesothoLiberiaLibyaLithuaniaLow & middle incomeLow incomeLower middle incomeLuxembourgMacedonia, FYRMadagascarMalawiMalaysiaMaldivesMaliMaltaMauritaniaMauritiusMexicoMicronesia, Fed. Sts.Middle East & North AfricaMiddle East & North Africa (excluding high income)Middle East & North Africa (IDA & IBRD countries)Middle incomeMoldovaMongoliaMontenegroMoroccoMozambiqueMyanmarNamibiaNepalNetherlandsNew CaledoniaNew ZealandNicaraguaNigerNigeriaNorth AmericaNorwayOECD membersOmanOther small statesPacific island small statesPakistanPanamaPapua New GuineaParaguayPeruPhilippinesPolandPortugalPost-demographic dividendPre-demographic dividendPuerto RicoQatarRomaniaRussian FederationRwandaSao Tome and PrincipeSaudi ArabiaSenegalSerbiaSierra LeoneSlovak RepublicSloveniaSmall statesSolomon IslandsSomaliaSouth AfricaSouth AsiaSouth Asia (IDA & IBRD)South SudanSpainSri LankaSt. LuciaSt. Vincent and the GrenadinesSub-Saharan Africa Sub-Saharan Africa (excluding high income)Sub-Saharan Africa (IDA & IBRD countries)SudanSurinameSwazilandSwedenSwitzerlandSyrian Arab RepublicTajikistanTanzaniaThailandTimor-LesteTogoTrinidad and TobagoTunisiaTurkeyTurkmenistanUgandaUkraineUnited Arab EmiratesUnited KingdomUnited StatesUpper middle incomeUruguayUzbekistanVanuatuVenezuela, RBVietnamWest Bank and GazaWorldYemen, Rep.ZambiaZimbabwe Timeline:
This timeline shows a graph from 1962 to 2015 of Europe & Central Asia (excluding high income). No data until 1961. Number of actual observations by date: 54.
Source name:
World Development Indicators
Source organization:
Food and Agriculture Organization, electronic files and web site.
Categories, topics:
Agriculture & Rural Development, Climate Change
Last updated:
apr 23, 2017
Indicators value changes by year
Minimum:
1.232K
jan 1, 1962
Maximum:
2.872K
jan 1, 2015
At the date of observation
Value
Absolute change
Change from previous value
jan 1, 1962
1.232K
+1.232K
0.0%
jan 1, 1963
1.302K
+70.425
5.72%
jan 1, 1964
1.458K
+155.481
11.94%
jan 1, 1965
1.39K
-68.148
-4.68%
jan 1, 1966
1.476K
+86.331
6.21%
jan 1, 1967
1.678K
+201.922
13.68%
jan 1, 1968
1.692K
+13.862
0.83%
jan 1, 1969
1.55K
-142.066
-8.4%
jan 1, 1970
1.639K
+89.214
5.76%
jan 1, 1971
1.575K
-64.256
-3.92%
jan 1, 1972
1.958K
+383.674
24.37%
jan 1, 1973
2.034K
+75.67
3.86%
jan 1, 1974
1.791K
-242.41
-11.92%
jan 1, 1975
1.761K
-29.977
-1.67%
jan 1, 1976
2.045K
+283.454
16.09%
jan 1, 1977
2.38K
+335.381
16.4%
jan 1, 1978
2.287K
-92.87
-3.9%
jan 1, 1979
2.305K
+17.73
0.78%
jan 1, 1980
2.375K
+69.431
3.01%
jan 1, 1981
2.371K
-4.087
-0.17%
jan 1, 1982
2.297K
-73.402
-3.1%
jan 1, 1983
2.619K
+321.779
14.01%
jan 1, 1984
2.34K
-278.664
-10.64%
jan 1, 1985
2.571K
+231.176
9.88%
jan 1, 1986
2.36K
-211.751
-8.23%
jan 1, 1987
2.617K
+257.771
10.92%
jan 1, 1988
2.476K
-141.612
-5.41%
jan 1, 1989
2.671K
+194.682
7.86%
jan 1, 1990
2.38K
-290.094
-10.86%
jan 1, 1991
2.597K
+216.161
9.08%
jan 1, 1992
2.671K
+73.985
2.85%
jan 1, 1993
1.905K
-765.252
-28.66%
jan 1, 1994
1.874K
-31.584
-1.66%
jan 1, 1995
1.683K
-191.023
-10.19%
jan 1, 1996
1.59K
-93.19
-5.54%
jan 1, 1997
1.571K
-18.297
-1.15%
jan 1, 1998
1.968K
+396.569
25.24%
jan 1, 1999
1.685K
-283.019
-14.38%
jan 1, 2000
1.806K
+121.406
7.21%
jan 1, 2001
1.731K
-74.696
-4.14%
jan 1, 2002
2.11K
+378.336
21.85%
jan 1, 2003
2.126K
+16.081
0.76%
jan 1, 2004
1.895K
-230.753
-10.85%
jan 1, 2005
2.234K
+338.699
17.87%
jan 1, 2006
2.172K
-61.369
-2.75%
jan 1, 2007
2.196K
+23.058
1.06%
jan 1, 2008
2.055K
-140.773
-6.41%
jan 1, 2009
2.542K
+486.81
23.69%
jan 1, 2010
2.452K
-89.105
-3.51%
jan 1, 2011
2.221K
-231.195
-9.43%
jan 1, 2012
2.734K
+512.337
23.07%
jan 1, 2013
2.203K
-530.388
-19.4%
jan 1, 2014
2.745K
+542.102
24.61%
jan 1, 2015
2.872K
+126.874
4.62%
Ranking of countries by current statistics by years


Comments: