29
/
en
AIzaSyAYiBZKx7MnpbEhh9jyipgxe19OcubqV5w
April 1, 2024
254939
Swaziland
SWZ
true
2
1
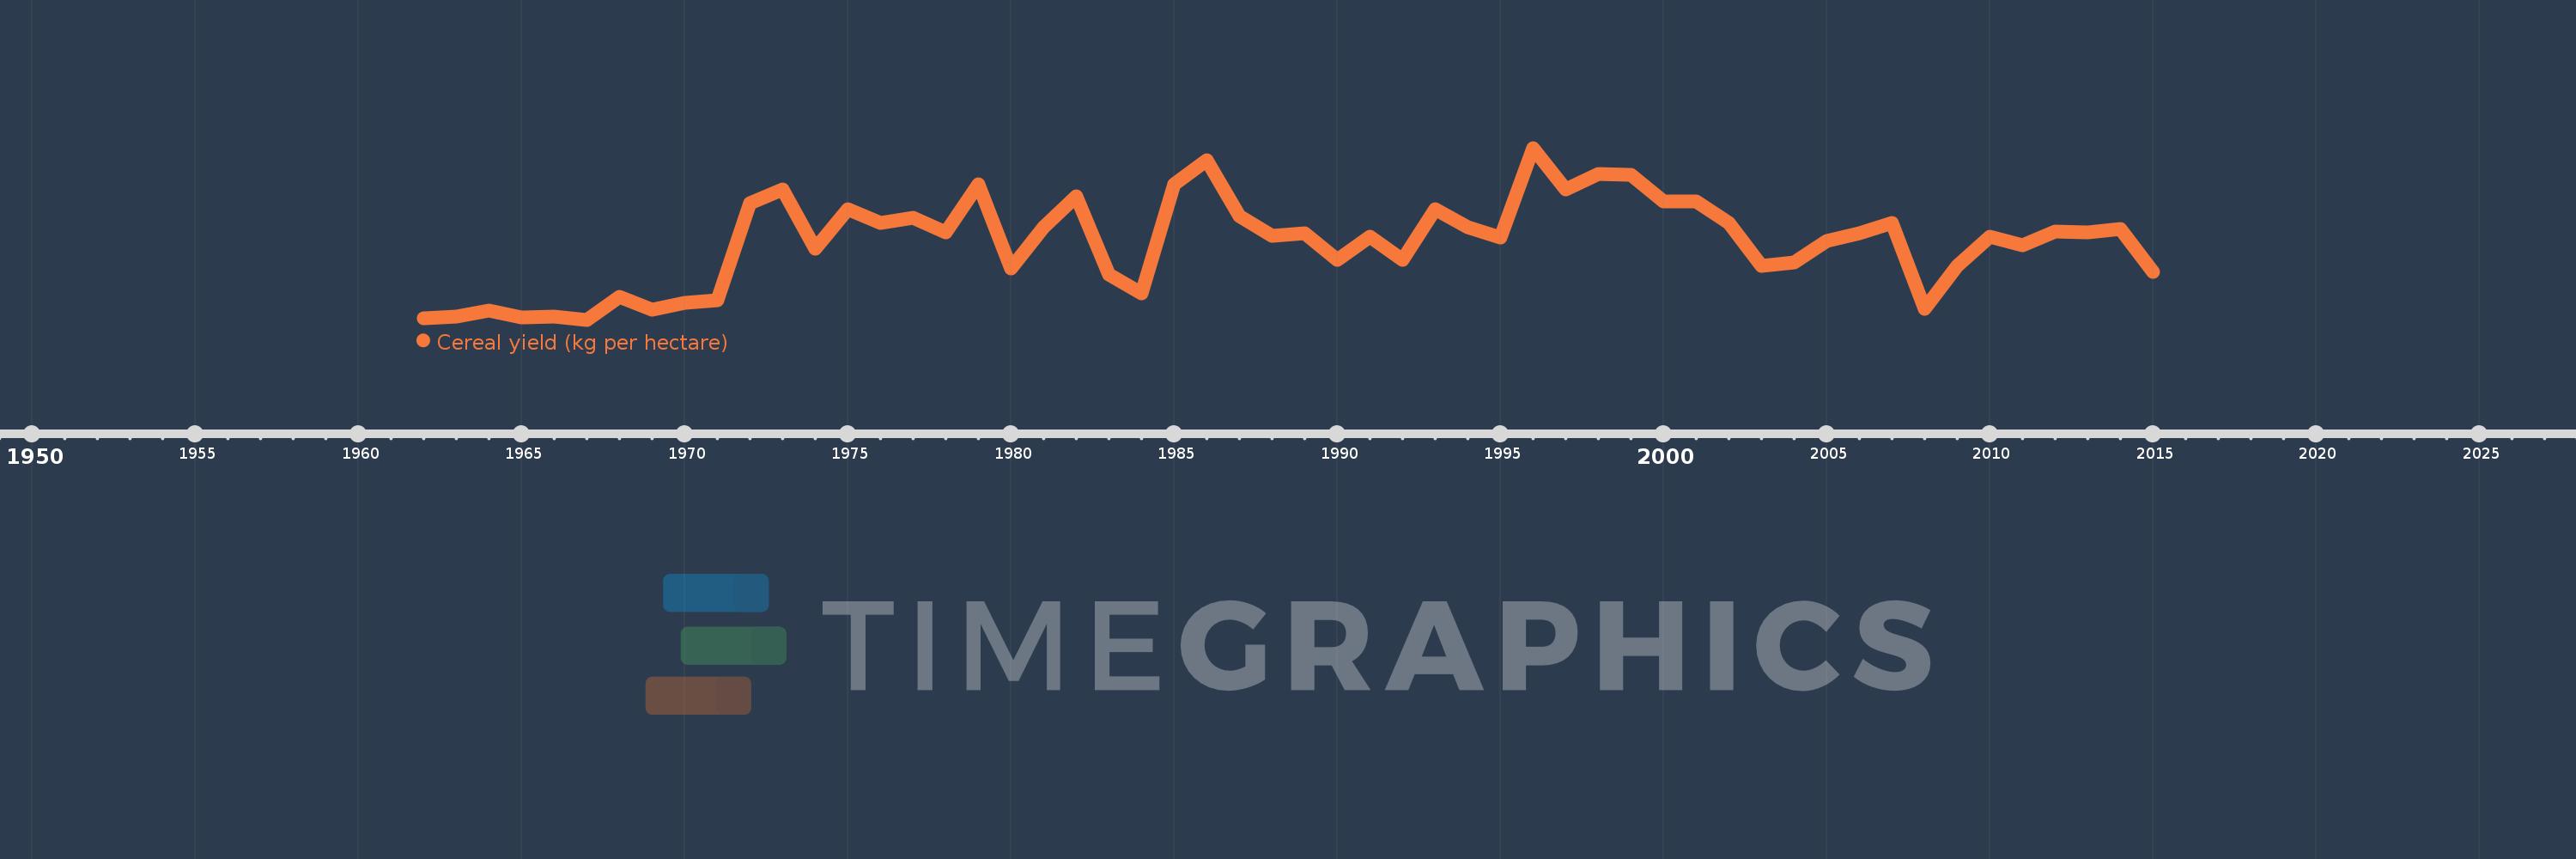
Cereal yield (kg per hectare)
2015,2014,2013,2012,2011,2010,2009,2008,2007,2006,2005,2004,2003,2002,2001,2000,1999,1998,1997,1996,1995,1994,1993,1992,1991,1990,1989,1988,1987,1986,1985,1984,1983,1982,1981,1980,1979,1978,1977,1976,1975,1974,1973,1972,1971,1970,1969,1968,1967,1966,1965,1964,1963,1962
This statistics in other country:
AfghanistanAlbaniaAlgeriaAngolaAntigua and BarbudaArab WorldArgentinaArmeniaAustraliaAustriaAzerbaijanBahamas, TheBangladeshBarbadosBelarusBelgiumBelizeBeninBhutanBoliviaBosnia and HerzegovinaBotswanaBrazilBrunei DarussalamBulgariaBurkina FasoBurundiCabo VerdeCambodiaCameroonCanadaCaribbean small statesCentral African RepublicCentral Europe and the BalticsChadChileChinaColombiaComorosCongo, Dem. Rep.Congo, Rep.Costa RicaCote d'IvoireCroatiaCubaCyprusCzech RepublicDenmarkDjiboutiDominicaDominican RepublicEarly-demographic dividendEast Asia & PacificEast Asia & Pacific (excluding high income)East Asia & Pacific (IDA & IBRD countries)EcuadorEgypt, Arab Rep.El SalvadorEritreaEstoniaEthiopiaEuro areaEurope & Central AsiaEurope & Central Asia (excluding high income)Europe & Central Asia (IDA & IBRD countries)European UnionFijiFinlandFragile and conflict affected situationsFranceGabonGambia, TheGeorgiaGermanyGhanaGreeceGrenadaGuamGuatemalaGuineaGuinea-BissauGuyanaHaitiHeavily indebted poor countries (HIPC)High incomeHondurasHong Kong SAR, ChinaHungaryIBRD onlyIDA & IBRD totalIDA blendIDA onlyIDA totalIndiaIndonesiaIran, Islamic Rep.IraqIrelandIsraelItalyJamaicaJapanJordanKazakhstanKenyaKorea, Dem. People’s Rep.Korea, Rep.KuwaitKyrgyz RepublicLao PDRLate-demographic dividendLatin America & Caribbean Latin America & Caribbean (excluding high income)Latin America & the Caribbean (IDA & IBRD countries)LatviaLeast developed countries: UN classificationLebanonLesothoLiberiaLibyaLithuaniaLow & middle incomeLow incomeLower middle incomeLuxembourgMacedonia, FYRMadagascarMalawiMalaysiaMaldivesMaliMaltaMauritaniaMauritiusMexicoMicronesia, Fed. Sts.Middle East & North AfricaMiddle East & North Africa (excluding high income)Middle East & North Africa (IDA & IBRD countries)Middle incomeMoldovaMongoliaMontenegroMoroccoMozambiqueMyanmarNamibiaNepalNetherlandsNew CaledoniaNew ZealandNicaraguaNigerNigeriaNorth AmericaNorwayOECD membersOmanOther small statesPacific island small statesPakistanPanamaPapua New GuineaParaguayPeruPhilippinesPolandPortugalPost-demographic dividendPre-demographic dividendPuerto RicoQatarRomaniaRussian FederationRwandaSao Tome and PrincipeSaudi ArabiaSenegalSerbiaSierra LeoneSlovak RepublicSloveniaSmall statesSolomon IslandsSomaliaSouth AfricaSouth AsiaSouth Asia (IDA & IBRD)South SudanSpainSri LankaSt. LuciaSt. Vincent and the GrenadinesSub-Saharan Africa Sub-Saharan Africa (excluding high income)Sub-Saharan Africa (IDA & IBRD countries)SudanSurinameSwazilandSwedenSwitzerlandSyrian Arab RepublicTajikistanTanzaniaThailandTimor-LesteTogoTrinidad and TobagoTunisiaTurkeyTurkmenistanUgandaUkraineUnited Arab EmiratesUnited KingdomUnited StatesUpper middle incomeUruguayUzbekistanVanuatuVenezuela, RBVietnamWest Bank and GazaWorldYemen, Rep.ZambiaZimbabwe Timeline:
This timeline shows a graph from 1962 to 2015 of Swaziland. No data until 1961. Number of actual observations by date: 54.
Source name:
World Development Indicators
Source organization:
Food and Agriculture Organization, electronic files and web site.
Categories, topics:
Agriculture & Rural Development, Climate Change
Last updated:
apr 23, 2017
Indicators value changes by year
At the date of observation
Value
Absolute change
Change from previous value
jan 1, 1962
469.3
+469.3
0.0%
jan 1, 1963
486.1
+16.8
3.58%
jan 1, 1964
541.1
+55.0
11.31%
jan 1, 1965
477.8
-63.3
-11.7%
jan 1, 1966
482.9
+5.1
1.07%
jan 1, 1967
453.4
-29.5
-6.11%
jan 1, 1968
685.1
+231.7
51.1%
jan 1, 1969
552.1
-133.0
-19.41%
jan 1, 1970
619.5
+67.4
12.21%
jan 1, 1971
648.2
+28.7
4.63%
jan 1, 1972
1.619K
+970.8
149.77%
jan 1, 1973
1.754K
+134.5
8.31%
jan 1, 1974
1.161K
-592.9
-33.81%
jan 1, 1975
1.554K
+393.7
33.92%
jan 1, 1976
1.419K
-135.6
-8.72%
jan 1, 1977
1.469K
+50.5
3.56%
jan 1, 1978
1.323K
-146.7
-9.99%
jan 1, 1979
1.803K
+480.8
36.36%
jan 1, 1980
967.1
-836.2
-46.37%
jan 1, 1981
1.381K
+414.3
42.84%
jan 1, 1982
1.685K
+304.0
22.01%
jan 1, 1983
901.5
-783.9
-46.51%
jan 1, 1984
720.2
-181.3
-20.11%
jan 1, 1985
1.803K
+1.083K
150.32%
jan 1, 1986
2.046K
+242.7
13.46%
jan 1, 1987
1.487K
-558.5
-27.3%
jan 1, 1988
1.289K
-198.1
-13.32%
jan 1, 1989
1.314K
+25.0
1.94%
jan 1, 1990
1.053K
-260.7
-19.84%
jan 1, 1991
1.284K
+230.8
21.91%
jan 1, 1992
1.05K
-233.6
-18.19%
jan 1, 1993
1.554K
+504.0
47.98%
jan 1, 1994
1.381K
-173.2
-11.14%
jan 1, 1995
1.272K
-109.1
-7.9%
jan 1, 1996
2.17K
+897.5
70.55%
jan 1, 1997
1.757K
-413.0
-19.04%
jan 1, 1998
1.906K
+149.4
8.51%
jan 1, 1999
1.898K
-8.3
-0.44%
jan 1, 2000
1.634K
-263.6
-13.89%
jan 1, 2001
1.633K
-0.8
-0.05%
jan 1, 2002
1.417K
-216.6
-13.26%
jan 1, 2003
994.6
-422.1
-29.79%
jan 1, 2004
1.022K
+27.8
2.8%
jan 1, 2005
1.244K
+221.7
21.68%
jan 1, 2006
1.314K
+69.9
5.62%
jan 1, 2007
1.418K
+104.4
7.95%
jan 1, 2008
560.5
-857.9
-60.48%
jan 1, 2009
995.4
+434.9
77.59%
jan 1, 2010
1.284K
+288.3
28.96%
jan 1, 2011
1.199K
-84.4
-6.57%
jan 1, 2012
1.335K
+136.2
11.36%
jan 1, 2013
1.329K
-6.6
-0.49%
jan 1, 2014
1.36K
+31.4
2.36%
jan 1, 2015
935.5
-424.8
-31.23%
Ranking of countries by current statistics by years


Comments: