29
/
en
AIzaSyAYiBZKx7MnpbEhh9jyipgxe19OcubqV5w
April 1, 2024
277404
Uruguay
URY
true
2
1
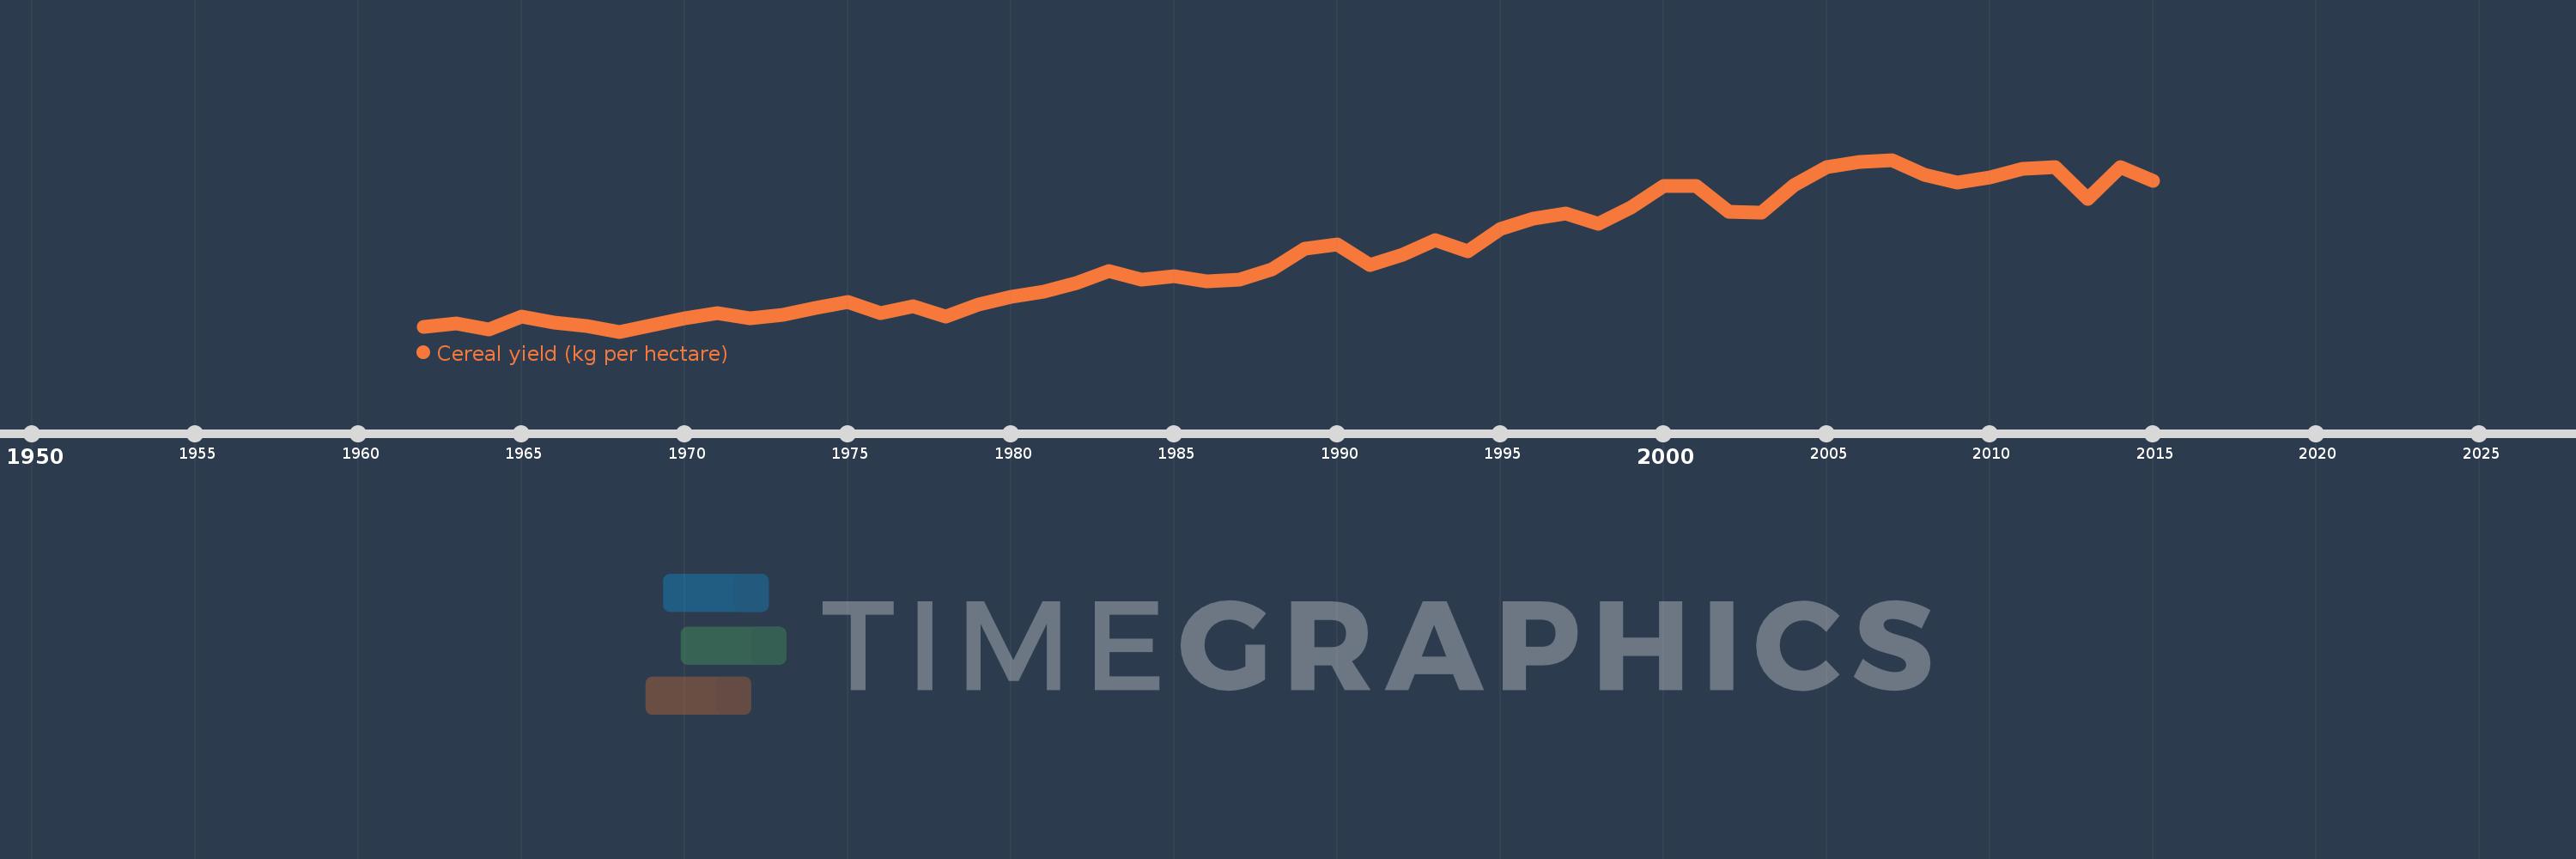
Cereal yield (kg per hectare)
2015,2014,2013,2012,2011,2010,2009,2008,2007,2006,2005,2004,2003,2002,2001,2000,1999,1998,1997,1996,1995,1994,1993,1992,1991,1990,1989,1988,1987,1986,1985,1984,1983,1982,1981,1980,1979,1978,1977,1976,1975,1974,1973,1972,1971,1970,1969,1968,1967,1966,1965,1964,1963,1962
This statistics in other country:
AfghanistanAlbaniaAlgeriaAngolaAntigua and BarbudaArab WorldArgentinaArmeniaAustraliaAustriaAzerbaijanBahamas, TheBangladeshBarbadosBelarusBelgiumBelizeBeninBhutanBoliviaBosnia and HerzegovinaBotswanaBrazilBrunei DarussalamBulgariaBurkina FasoBurundiCabo VerdeCambodiaCameroonCanadaCaribbean small statesCentral African RepublicCentral Europe and the BalticsChadChileChinaColombiaComorosCongo, Dem. Rep.Congo, Rep.Costa RicaCote d'IvoireCroatiaCubaCyprusCzech RepublicDenmarkDjiboutiDominicaDominican RepublicEarly-demographic dividendEast Asia & PacificEast Asia & Pacific (excluding high income)East Asia & Pacific (IDA & IBRD countries)EcuadorEgypt, Arab Rep.El SalvadorEritreaEstoniaEthiopiaEuro areaEurope & Central AsiaEurope & Central Asia (excluding high income)Europe & Central Asia (IDA & IBRD countries)European UnionFijiFinlandFragile and conflict affected situationsFranceGabonGambia, TheGeorgiaGermanyGhanaGreeceGrenadaGuamGuatemalaGuineaGuinea-BissauGuyanaHaitiHeavily indebted poor countries (HIPC)High incomeHondurasHong Kong SAR, ChinaHungaryIBRD onlyIDA & IBRD totalIDA blendIDA onlyIDA totalIndiaIndonesiaIran, Islamic Rep.IraqIrelandIsraelItalyJamaicaJapanJordanKazakhstanKenyaKorea, Dem. People’s Rep.Korea, Rep.KuwaitKyrgyz RepublicLao PDRLate-demographic dividendLatin America & Caribbean Latin America & Caribbean (excluding high income)Latin America & the Caribbean (IDA & IBRD countries)LatviaLeast developed countries: UN classificationLebanonLesothoLiberiaLibyaLithuaniaLow & middle incomeLow incomeLower middle incomeLuxembourgMacedonia, FYRMadagascarMalawiMalaysiaMaldivesMaliMaltaMauritaniaMauritiusMexicoMicronesia, Fed. Sts.Middle East & North AfricaMiddle East & North Africa (excluding high income)Middle East & North Africa (IDA & IBRD countries)Middle incomeMoldovaMongoliaMontenegroMoroccoMozambiqueMyanmarNamibiaNepalNetherlandsNew CaledoniaNew ZealandNicaraguaNigerNigeriaNorth AmericaNorwayOECD membersOmanOther small statesPacific island small statesPakistanPanamaPapua New GuineaParaguayPeruPhilippinesPolandPortugalPost-demographic dividendPre-demographic dividendPuerto RicoQatarRomaniaRussian FederationRwandaSao Tome and PrincipeSaudi ArabiaSenegalSerbiaSierra LeoneSlovak RepublicSloveniaSmall statesSolomon IslandsSomaliaSouth AfricaSouth AsiaSouth Asia (IDA & IBRD)South SudanSpainSri LankaSt. LuciaSt. Vincent and the GrenadinesSub-Saharan Africa Sub-Saharan Africa (excluding high income)Sub-Saharan Africa (IDA & IBRD countries)SudanSurinameSwazilandSwedenSwitzerlandSyrian Arab RepublicTajikistanTanzaniaThailandTimor-LesteTogoTrinidad and TobagoTunisiaTurkeyTurkmenistanUgandaUkraineUnited Arab EmiratesUnited KingdomUnited StatesUpper middle incomeUruguayUzbekistanVanuatuVenezuela, RBVietnamWest Bank and GazaWorldYemen, Rep.ZambiaZimbabwe Timeline:
This timeline shows a graph from 1962 to 2015 of Uruguay. No data until 1961. Number of actual observations by date: 54.
Source name:
World Development Indicators
Source organization:
Food and Agriculture Organization, electronic files and web site.
Categories, topics:
Agriculture & Rural Development, Climate Change
Last updated:
apr 23, 2017
Indicators value changes by year
Maximum:
4.456K
jan 1, 2007
At the date of observation
Value
Absolute change
Change from previous value
jan 1, 1962
859.7
+859.7
0.0%
jan 1, 1963
936.9
+77.2
8.98%
jan 1, 1964
794.6
-142.3
-15.19%
jan 1, 1965
1.084K
+289.6
36.45%
jan 1, 1966
951.4
-132.8
-12.25%
jan 1, 1967
872.5
-78.9
-8.29%
jan 1, 1968
753.1
-119.4
-13.68%
jan 1, 1969
890.5
+137.4
18.24%
jan 1, 1970
1.039K
+148.3
16.65%
jan 1, 1971
1.157K
+118.2
11.38%
jan 1, 1972
1.035K
-122.0
-10.54%
jan 1, 1973
1.118K
+82.8
8.0%
jan 1, 1974
1.265K
+147.4
13.19%
jan 1, 1975
1.385K
+120.0
9.48%
jan 1, 1976
1.158K
-227.4
-16.42%
jan 1, 1977
1.296K
+138.4
11.95%
jan 1, 1978
1.079K
-216.7
-16.72%
jan 1, 1979
1.344K
+264.4
24.49%
jan 1, 1980
1.509K
+165.3
12.3%
jan 1, 1981
1.618K
+109.1
7.23%
jan 1, 1982
1.804K
+185.8
11.48%
jan 1, 1983
2.056K
+251.9
13.96%
jan 1, 1984
1.876K
-179.7
-8.74%
jan 1, 1985
1.955K
+78.9
4.21%
jan 1, 1986
1.841K
-114.3
-5.85%
jan 1, 1987
1.871K
+29.7
1.61%
jan 1, 1988
2.1K
+229.5
12.27%
jan 1, 1989
2.539K
+438.9
20.9%
jan 1, 1990
2.634K
+94.7
3.73%
jan 1, 1991
2.182K
-451.4
-17.14%
jan 1, 1992
2.419K
+237.1
10.86%
jan 1, 1993
2.733K
+314.0
12.98%
jan 1, 1994
2.479K
-254.8
-9.32%
jan 1, 1995
2.969K
+490.8
19.8%
jan 1, 1996
3.188K
+218.4
7.36%
jan 1, 1997
3.29K
+102.3
3.21%
jan 1, 1998
3.078K
-212.1
-6.45%
jan 1, 1999
3.435K
+356.9
11.6%
jan 1, 2000
3.896K
+461.3
13.43%
jan 1, 2001
3.892K
-3.8
-0.1%
jan 1, 2002
3.338K
-554.4
-14.24%
jan 1, 2003
3.32K
-18.3
-0.55%
jan 1, 2004
3.906K
+586.8
17.68%
jan 1, 2005
4.299K
+392.4
10.04%
jan 1, 2006
4.405K
+105.7
2.46%
jan 1, 2007
4.456K
+51.6
1.17%
jan 1, 2008
4.132K
-324.5
-7.28%
jan 1, 2009
3.958K
-173.8
-4.21%
jan 1, 2010
4.076K
+118.5
2.99%
jan 1, 2011
4.256K
+179.8
4.41%
jan 1, 2012
4.305K
+48.4
1.14%
jan 1, 2013
3.622K
-683.0
-15.87%
jan 1, 2014
4.302K
+680.4
18.79%
jan 1, 2015
4.003K
-298.6
-6.94%
Ranking of countries by current statistics by years


Comments: