29
/
en
AIzaSyAYiBZKx7MnpbEhh9jyipgxe19OcubqV5w
April 1, 2024
44873
Low & middle income
LMY
false
2
1
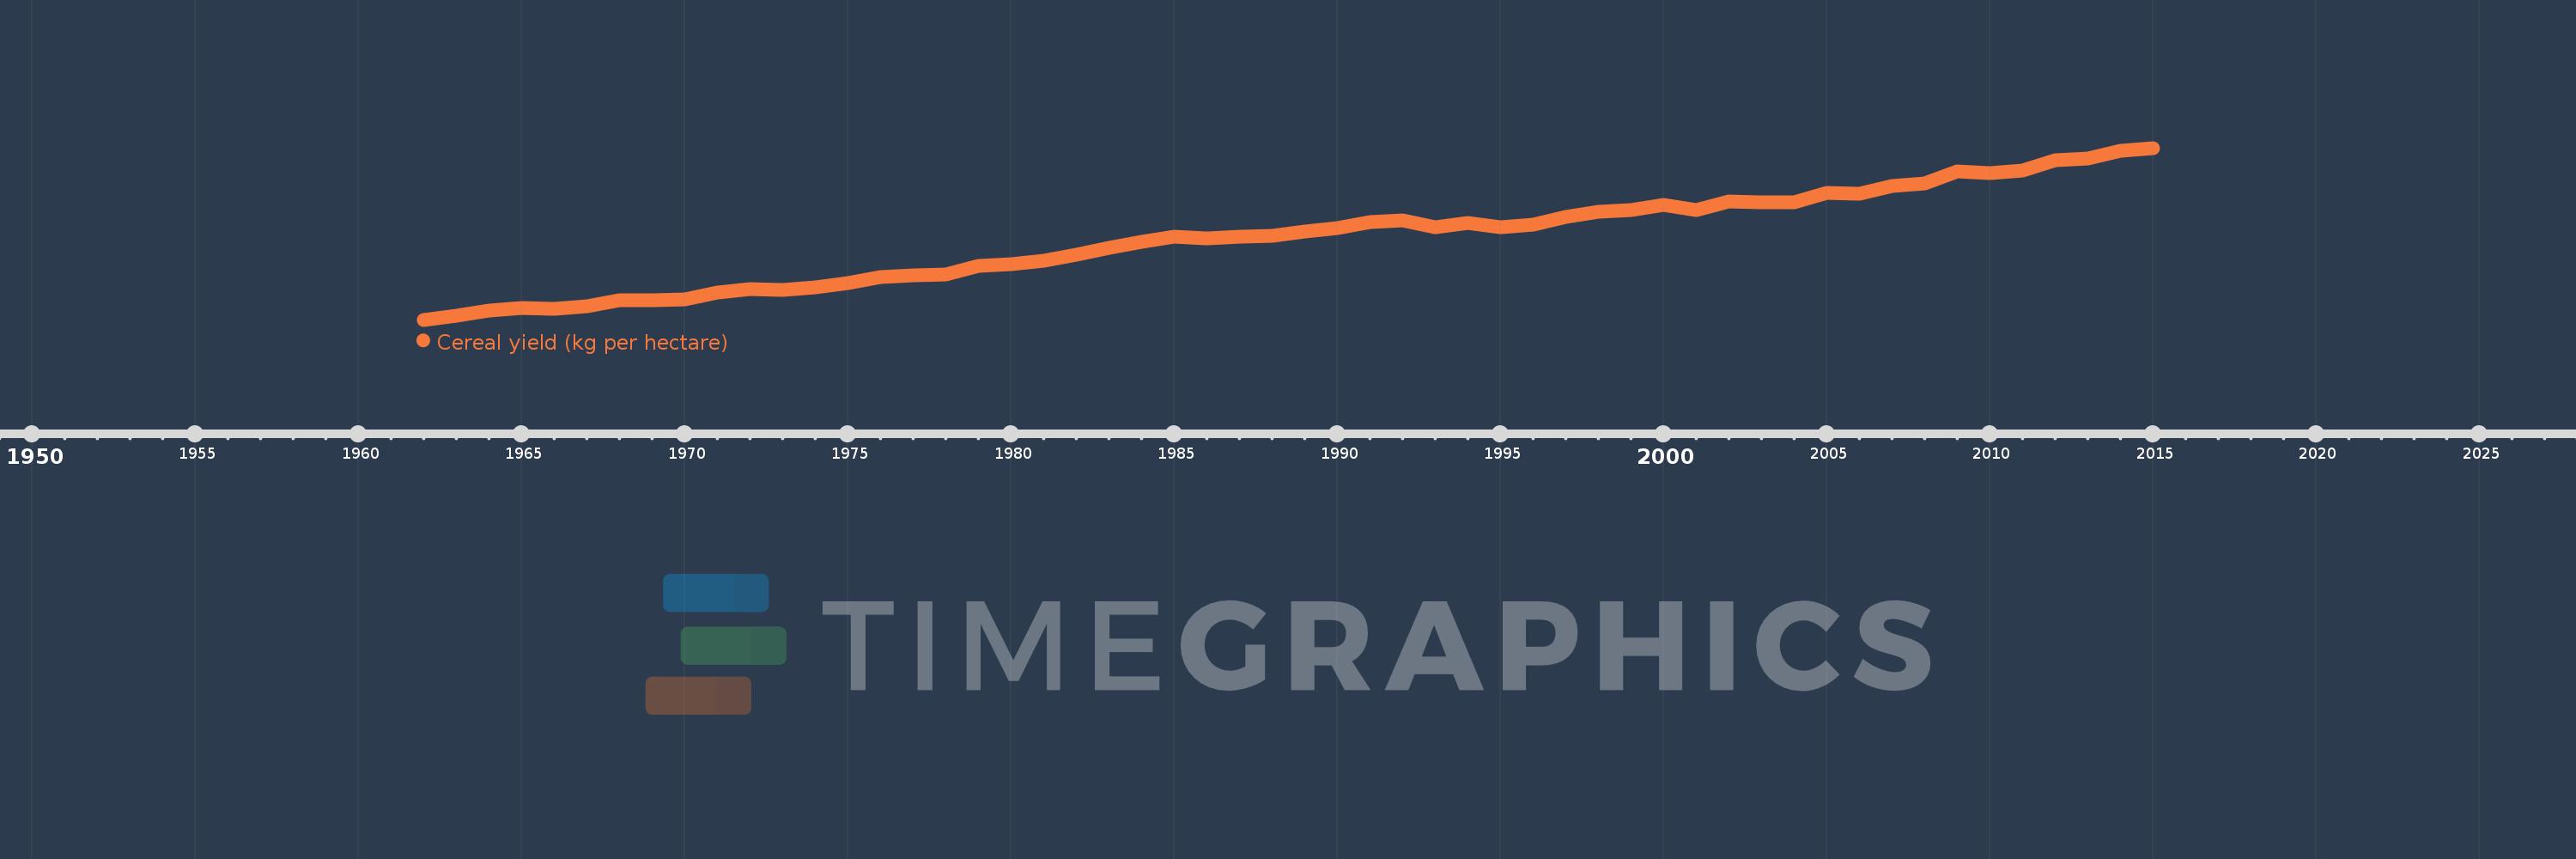
Cereal yield (kg per hectare)
2015,2014,2013,2012,2011,2010,2009,2008,2007,2006,2005,2004,2003,2002,2001,2000,1999,1998,1997,1996,1995,1994,1993,1992,1991,1990,1989,1988,1987,1986,1985,1984,1983,1982,1981,1980,1979,1978,1977,1976,1975,1974,1973,1972,1971,1970,1969,1968,1967,1966,1965,1964,1963,1962
This statistics in other country:
AfghanistanAlbaniaAlgeriaAngolaAntigua and BarbudaArab WorldArgentinaArmeniaAustraliaAustriaAzerbaijanBahamas, TheBangladeshBarbadosBelarusBelgiumBelizeBeninBhutanBoliviaBosnia and HerzegovinaBotswanaBrazilBrunei DarussalamBulgariaBurkina FasoBurundiCabo VerdeCambodiaCameroonCanadaCaribbean small statesCentral African RepublicCentral Europe and the BalticsChadChileChinaColombiaComorosCongo, Dem. Rep.Congo, Rep.Costa RicaCote d'IvoireCroatiaCubaCyprusCzech RepublicDenmarkDjiboutiDominicaDominican RepublicEarly-demographic dividendEast Asia & PacificEast Asia & Pacific (excluding high income)East Asia & Pacific (IDA & IBRD countries)EcuadorEgypt, Arab Rep.El SalvadorEritreaEstoniaEthiopiaEuro areaEurope & Central AsiaEurope & Central Asia (excluding high income)Europe & Central Asia (IDA & IBRD countries)European UnionFijiFinlandFragile and conflict affected situationsFranceGabonGambia, TheGeorgiaGermanyGhanaGreeceGrenadaGuamGuatemalaGuineaGuinea-BissauGuyanaHaitiHeavily indebted poor countries (HIPC)High incomeHondurasHong Kong SAR, ChinaHungaryIBRD onlyIDA & IBRD totalIDA blendIDA onlyIDA totalIndiaIndonesiaIran, Islamic Rep.IraqIrelandIsraelItalyJamaicaJapanJordanKazakhstanKenyaKorea, Dem. People’s Rep.Korea, Rep.KuwaitKyrgyz RepublicLao PDRLate-demographic dividendLatin America & Caribbean Latin America & Caribbean (excluding high income)Latin America & the Caribbean (IDA & IBRD countries)LatviaLeast developed countries: UN classificationLebanonLesothoLiberiaLibyaLithuaniaLow & middle incomeLow incomeLower middle incomeLuxembourgMacedonia, FYRMadagascarMalawiMalaysiaMaldivesMaliMaltaMauritaniaMauritiusMexicoMicronesia, Fed. Sts.Middle East & North AfricaMiddle East & North Africa (excluding high income)Middle East & North Africa (IDA & IBRD countries)Middle incomeMoldovaMongoliaMontenegroMoroccoMozambiqueMyanmarNamibiaNepalNetherlandsNew CaledoniaNew ZealandNicaraguaNigerNigeriaNorth AmericaNorwayOECD membersOmanOther small statesPacific island small statesPakistanPanamaPapua New GuineaParaguayPeruPhilippinesPolandPortugalPost-demographic dividendPre-demographic dividendPuerto RicoQatarRomaniaRussian FederationRwandaSao Tome and PrincipeSaudi ArabiaSenegalSerbiaSierra LeoneSlovak RepublicSloveniaSmall statesSolomon IslandsSomaliaSouth AfricaSouth AsiaSouth Asia (IDA & IBRD)South SudanSpainSri LankaSt. LuciaSt. Vincent and the GrenadinesSub-Saharan Africa Sub-Saharan Africa (excluding high income)Sub-Saharan Africa (IDA & IBRD countries)SudanSurinameSwazilandSwedenSwitzerlandSyrian Arab RepublicTajikistanTanzaniaThailandTimor-LesteTogoTrinidad and TobagoTunisiaTurkeyTurkmenistanUgandaUkraineUnited Arab EmiratesUnited KingdomUnited StatesUpper middle incomeUruguayUzbekistanVanuatuVenezuela, RBVietnamWest Bank and GazaWorldYemen, Rep.ZambiaZimbabwe Timeline:
This timeline shows a graph from 1962 to 2015 of Low & middle income. No data until 1961. Number of actual observations by date: 54.
Source name:
World Development Indicators
Source organization:
Food and Agriculture Organization, electronic files and web site.
Categories, topics:
Agriculture & Rural Development, Climate Change
Last updated:
apr 23, 2017
Indicators value changes by year
Maximum:
3.395K
jan 1, 2015
At the date of observation
Value
Absolute change
Change from previous value
jan 1, 1962
1.11K
+1.11K
0.0%
jan 1, 1963
1.165K
+55.592
5.01%
jan 1, 1964
1.227K
+62.087
5.33%
jan 1, 1965
1.264K
+36.481
2.97%
jan 1, 1966
1.254K
-9.814
-0.78%
jan 1, 1967
1.294K
+40.435
3.22%
jan 1, 1968
1.37K
+75.996
5.87%
jan 1, 1969
1.369K
-1.554
-0.11%
jan 1, 1970
1.379K
+10.303
0.75%
jan 1, 1971
1.474K
+95.203
6.9%
jan 1, 1972
1.52K
+45.8
3.11%
jan 1, 1973
1.502K
-17.839
-1.17%
jan 1, 1974
1.542K
+39.387
2.62%
jan 1, 1975
1.595K
+52.838
3.43%
jan 1, 1976
1.683K
+88.101
5.53%
jan 1, 1977
1.697K
+13.987
0.83%
jan 1, 1978
1.715K
+18.539
1.09%
jan 1, 1979
1.821K
+106.224
6.19%
jan 1, 1980
1.85K
+28.445
1.56%
jan 1, 1981
1.892K
+42.39
2.29%
jan 1, 1982
1.978K
+85.286
4.51%
jan 1, 1983
2.063K
+85.256
4.31%
jan 1, 1984
2.142K
+79.721
3.86%
jan 1, 1985
2.219K
+76.927
3.59%
jan 1, 1986
2.188K
-31.008
-1.4%
jan 1, 1987
2.213K
+24.96
1.14%
jan 1, 1988
2.224K
+10.265
0.46%
jan 1, 1989
2.281K
+57.613
2.59%
jan 1, 1990
2.332K
+50.739
2.22%
jan 1, 1991
2.413K
+81.394
3.49%
jan 1, 1992
2.427K
+13.325
0.55%
jan 1, 1993
2.335K
-91.255
-3.76%
jan 1, 1994
2.397K
+62.03
2.66%
jan 1, 1995
2.343K
-54.029
-2.25%
jan 1, 1996
2.38K
+36.555
1.56%
jan 1, 1997
2.479K
+99.167
4.17%
jan 1, 1998
2.541K
+61.671
2.49%
jan 1, 1999
2.572K
+31.354
1.23%
jan 1, 2000
2.632K
+59.83
2.33%
jan 1, 2001
2.574K
-58.502
-2.22%
jan 1, 2002
2.687K
+113.201
4.4%
jan 1, 2003
2.669K
-17.617
-0.66%
jan 1, 2004
2.668K
-1.097
-0.04%
jan 1, 2005
2.799K
+131.126
4.91%
jan 1, 2006
2.79K
-9.429
-0.34%
jan 1, 2007
2.89K
+100.047
3.59%
jan 1, 2008
2.917K
+27.582
0.95%
jan 1, 2009
3.081K
+163.434
5.6%
jan 1, 2010
3.061K
-19.83
-0.64%
jan 1, 2011
3.095K
+34.441
1.13%
jan 1, 2012
3.23K
+134.891
4.36%
jan 1, 2013
3.25K
+20.022
0.62%
jan 1, 2014
3.359K
+108.592
3.34%
jan 1, 2015
3.395K
+35.684
1.06%
Ranking of countries by current statistics by years


Comments: