29
/
en
AIzaSyAYiBZKx7MnpbEhh9jyipgxe19OcubqV5w
April 1, 2024
147699
Guyana
GUY
true
2
1
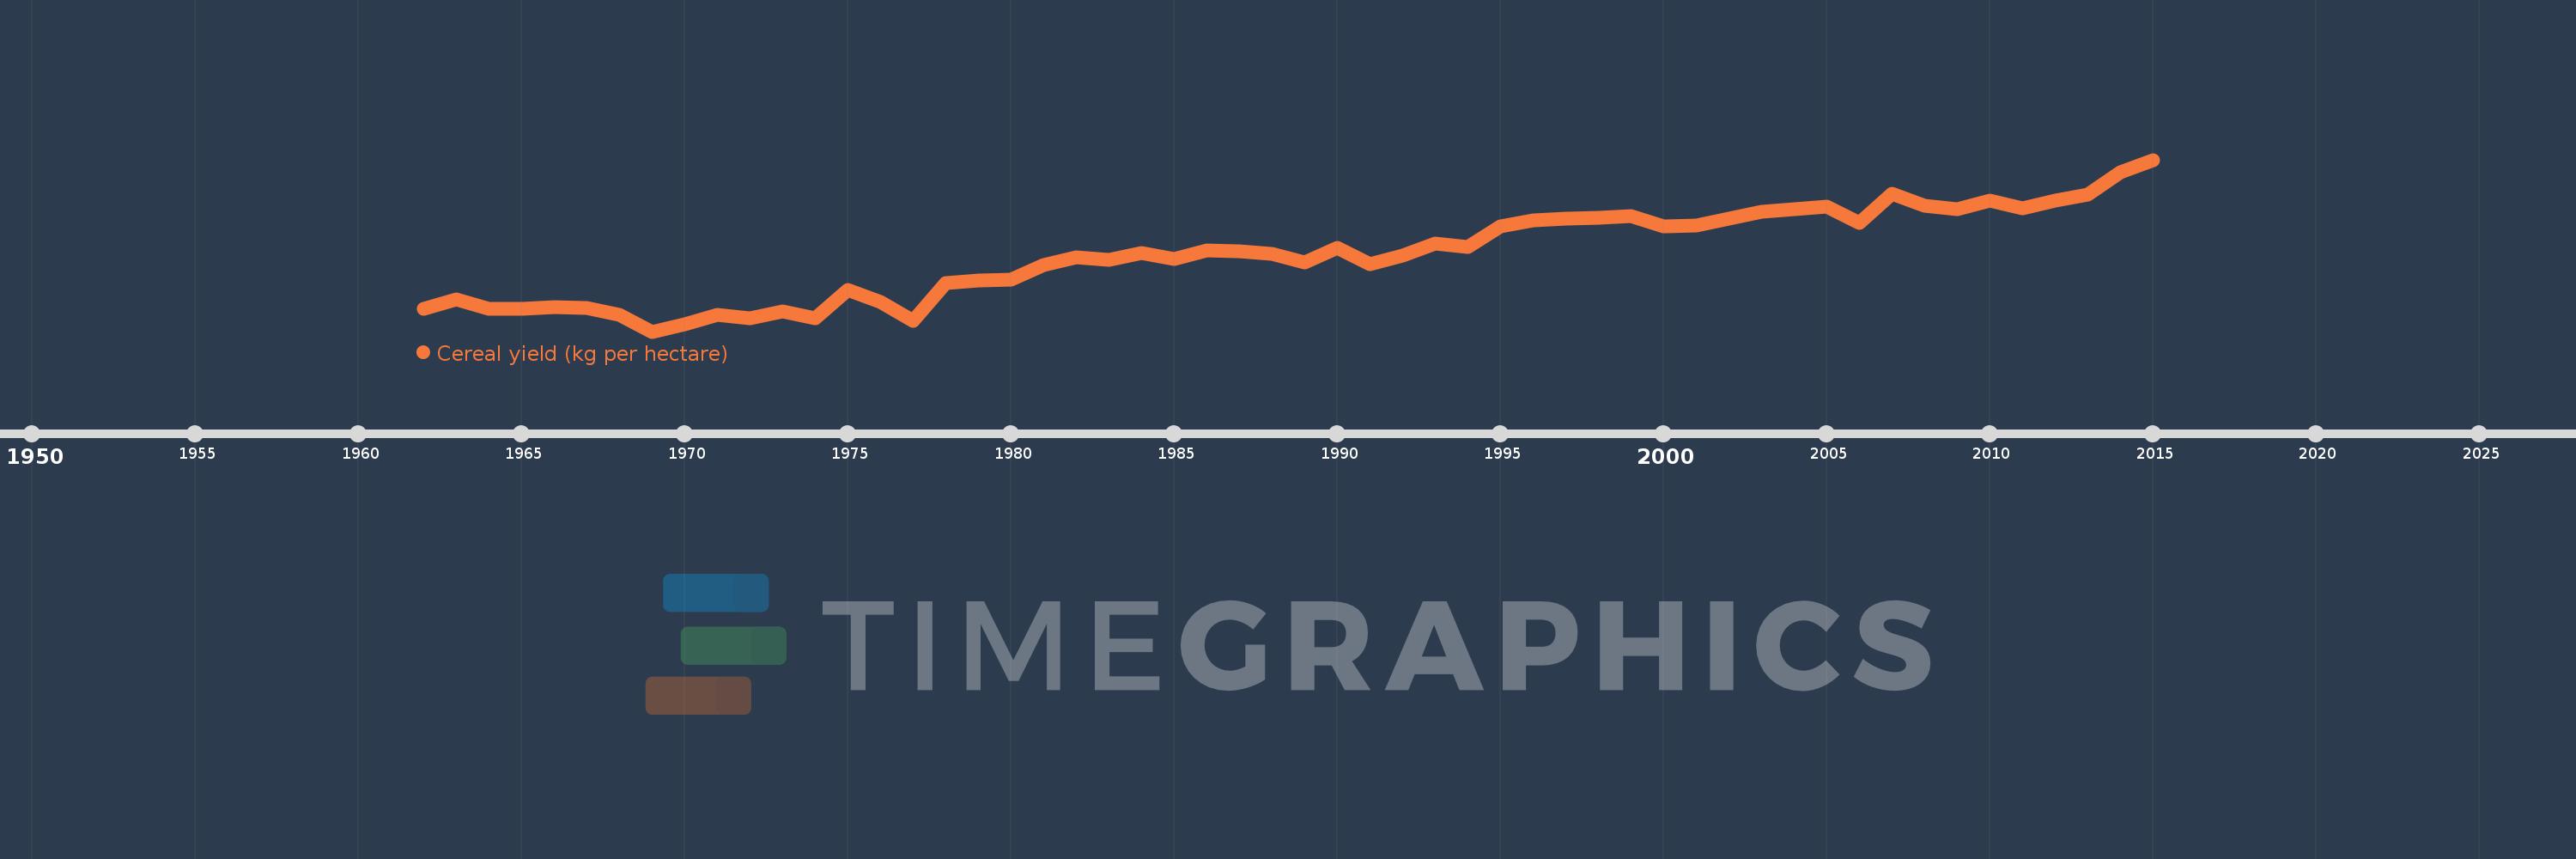
Cereal yield (kg per hectare)
2015,2014,2013,2012,2011,2010,2009,2008,2007,2006,2005,2004,2003,2002,2001,2000,1999,1998,1997,1996,1995,1994,1993,1992,1991,1990,1989,1988,1987,1986,1985,1984,1983,1982,1981,1980,1979,1978,1977,1976,1975,1974,1973,1972,1971,1970,1969,1968,1967,1966,1965,1964,1963,1962
This statistics in other country:
AfghanistanAlbaniaAlgeriaAngolaAntigua and BarbudaArab WorldArgentinaArmeniaAustraliaAustriaAzerbaijanBahamas, TheBangladeshBarbadosBelarusBelgiumBelizeBeninBhutanBoliviaBosnia and HerzegovinaBotswanaBrazilBrunei DarussalamBulgariaBurkina FasoBurundiCabo VerdeCambodiaCameroonCanadaCaribbean small statesCentral African RepublicCentral Europe and the BalticsChadChileChinaColombiaComorosCongo, Dem. Rep.Congo, Rep.Costa RicaCote d'IvoireCroatiaCubaCyprusCzech RepublicDenmarkDjiboutiDominicaDominican RepublicEarly-demographic dividendEast Asia & PacificEast Asia & Pacific (excluding high income)East Asia & Pacific (IDA & IBRD countries)EcuadorEgypt, Arab Rep.El SalvadorEritreaEstoniaEthiopiaEuro areaEurope & Central AsiaEurope & Central Asia (excluding high income)Europe & Central Asia (IDA & IBRD countries)European UnionFijiFinlandFragile and conflict affected situationsFranceGabonGambia, TheGeorgiaGermanyGhanaGreeceGrenadaGuamGuatemalaGuineaGuinea-BissauGuyanaHaitiHeavily indebted poor countries (HIPC)High incomeHondurasHong Kong SAR, ChinaHungaryIBRD onlyIDA & IBRD totalIDA blendIDA onlyIDA totalIndiaIndonesiaIran, Islamic Rep.IraqIrelandIsraelItalyJamaicaJapanJordanKazakhstanKenyaKorea, Dem. People’s Rep.Korea, Rep.KuwaitKyrgyz RepublicLao PDRLate-demographic dividendLatin America & Caribbean Latin America & Caribbean (excluding high income)Latin America & the Caribbean (IDA & IBRD countries)LatviaLeast developed countries: UN classificationLebanonLesothoLiberiaLibyaLithuaniaLow & middle incomeLow incomeLower middle incomeLuxembourgMacedonia, FYRMadagascarMalawiMalaysiaMaldivesMaliMaltaMauritaniaMauritiusMexicoMicronesia, Fed. Sts.Middle East & North AfricaMiddle East & North Africa (excluding high income)Middle East & North Africa (IDA & IBRD countries)Middle incomeMoldovaMongoliaMontenegroMoroccoMozambiqueMyanmarNamibiaNepalNetherlandsNew CaledoniaNew ZealandNicaraguaNigerNigeriaNorth AmericaNorwayOECD membersOmanOther small statesPacific island small statesPakistanPanamaPapua New GuineaParaguayPeruPhilippinesPolandPortugalPost-demographic dividendPre-demographic dividendPuerto RicoQatarRomaniaRussian FederationRwandaSao Tome and PrincipeSaudi ArabiaSenegalSerbiaSierra LeoneSlovak RepublicSloveniaSmall statesSolomon IslandsSomaliaSouth AfricaSouth AsiaSouth Asia (IDA & IBRD)South SudanSpainSri LankaSt. LuciaSt. Vincent and the GrenadinesSub-Saharan Africa Sub-Saharan Africa (excluding high income)Sub-Saharan Africa (IDA & IBRD countries)SudanSurinameSwazilandSwedenSwitzerlandSyrian Arab RepublicTajikistanTanzaniaThailandTimor-LesteTogoTrinidad and TobagoTunisiaTurkeyTurkmenistanUgandaUkraineUnited Arab EmiratesUnited KingdomUnited StatesUpper middle incomeUruguayUzbekistanVanuatuVenezuela, RBVietnamWest Bank and GazaWorldYemen, Rep.ZambiaZimbabwe Timeline:
This timeline shows a graph from 1962 to 2015 of Guyana. No data until 1961. Number of actual observations by date: 54.
Source name:
World Development Indicators
Source organization:
Food and Agriculture Organization, electronic files and web site.
Categories, topics:
Agriculture & Rural Development, Climate Change
Last updated:
apr 23, 2017
Indicators value changes by year
Minimum:
1.531K
jan 1, 1969
Maximum:
5.211K
jan 1, 2015
At the date of observation
Value
Absolute change
Change from previous value
jan 1, 1962
2.014K
+2.014K
0.0%
jan 1, 1963
2.217K
+203.3
10.1%
jan 1, 1964
2.018K
-199.2
-8.98%
jan 1, 1965
2.011K
-7.3
-0.36%
jan 1, 1966
2.053K
+42.3
2.1%
jan 1, 1967
2.031K
-22.1
-1.08%
jan 1, 1968
1.899K
-132.3
-6.51%
jan 1, 1969
1.531K
-367.2
-19.34%
jan 1, 1970
1.689K
+157.6
10.29%
jan 1, 1971
1.887K
+198.3
11.74%
jan 1, 1972
1.821K
-66.2
-3.51%
jan 1, 1973
1.971K
+150.2
8.25%
jan 1, 1974
1.821K
-150.1
-7.61%
jan 1, 1975
2.421K
+600.3
32.96%
jan 1, 1976
2.173K
-248.2
-10.25%
jan 1, 1977
1.76K
-412.7
-18.99%
jan 1, 1978
2.578K
+817.0
46.41%
jan 1, 1979
2.633K
+55.5
2.15%
jan 1, 1980
2.652K
+18.9
0.72%
jan 1, 1981
2.953K
+301.4
11.37%
jan 1, 1982
3.116K
+163.0
5.52%
jan 1, 1983
3.061K
-55.5
-1.78%
jan 1, 1984
3.221K
+160.7
5.25%
jan 1, 1985
3.079K
-142.8
-4.43%
jan 1, 1986
3.261K
+182.8
5.94%
jan 1, 1987
3.247K
-14.4
-0.44%
jan 1, 1988
3.189K
-57.9
-1.78%
jan 1, 1989
3.006K
-182.7
-5.73%
jan 1, 1990
3.321K
+314.2
10.45%
jan 1, 1991
2.98K
-340.3
-10.25%
jan 1, 1992
3.156K
+175.8
5.9%
jan 1, 1993
3.426K
+269.5
8.54%
jan 1, 1994
3.349K
-76.9
-2.24%
jan 1, 1995
3.787K
+438.5
13.09%
jan 1, 1996
3.917K
+129.8
3.43%
jan 1, 1997
3.958K
+41.4
1.06%
jan 1, 1998
3.964K
+5.6
0.14%
jan 1, 1999
4.003K
+39.0
0.98%
jan 1, 2000
3.791K
-212.0
-5.3%
jan 1, 2001
3.803K
+11.8
0.31%
jan 1, 2002
3.948K
+145.0
3.81%
jan 1, 2003
4.09K
+142.1
3.6%
jan 1, 2004
4.156K
+65.6
1.6%
jan 1, 2005
4.206K
+50.1
1.21%
jan 1, 2006
3.862K
-344.0
-8.18%
jan 1, 2007
4.488K
+626.4
16.22%
jan 1, 2008
4.223K
-265.5
-5.92%
jan 1, 2009
4.161K
-61.4
-1.45%
jan 1, 2010
4.346K
+185.0
4.45%
jan 1, 2011
4.164K
-181.9
-4.19%
jan 1, 2012
4.337K
+172.2
4.14%
jan 1, 2013
4.465K
+128.8
2.97%
jan 1, 2014
4.936K
+470.6
10.54%
jan 1, 2015
5.211K
+275.3
5.58%
Ranking of countries by current statistics by years


Comments: