29
/
en
AIzaSyAYiBZKx7MnpbEhh9jyipgxe19OcubqV5w
April 1, 2024
46909
Lower middle income
LMC
false
2
1
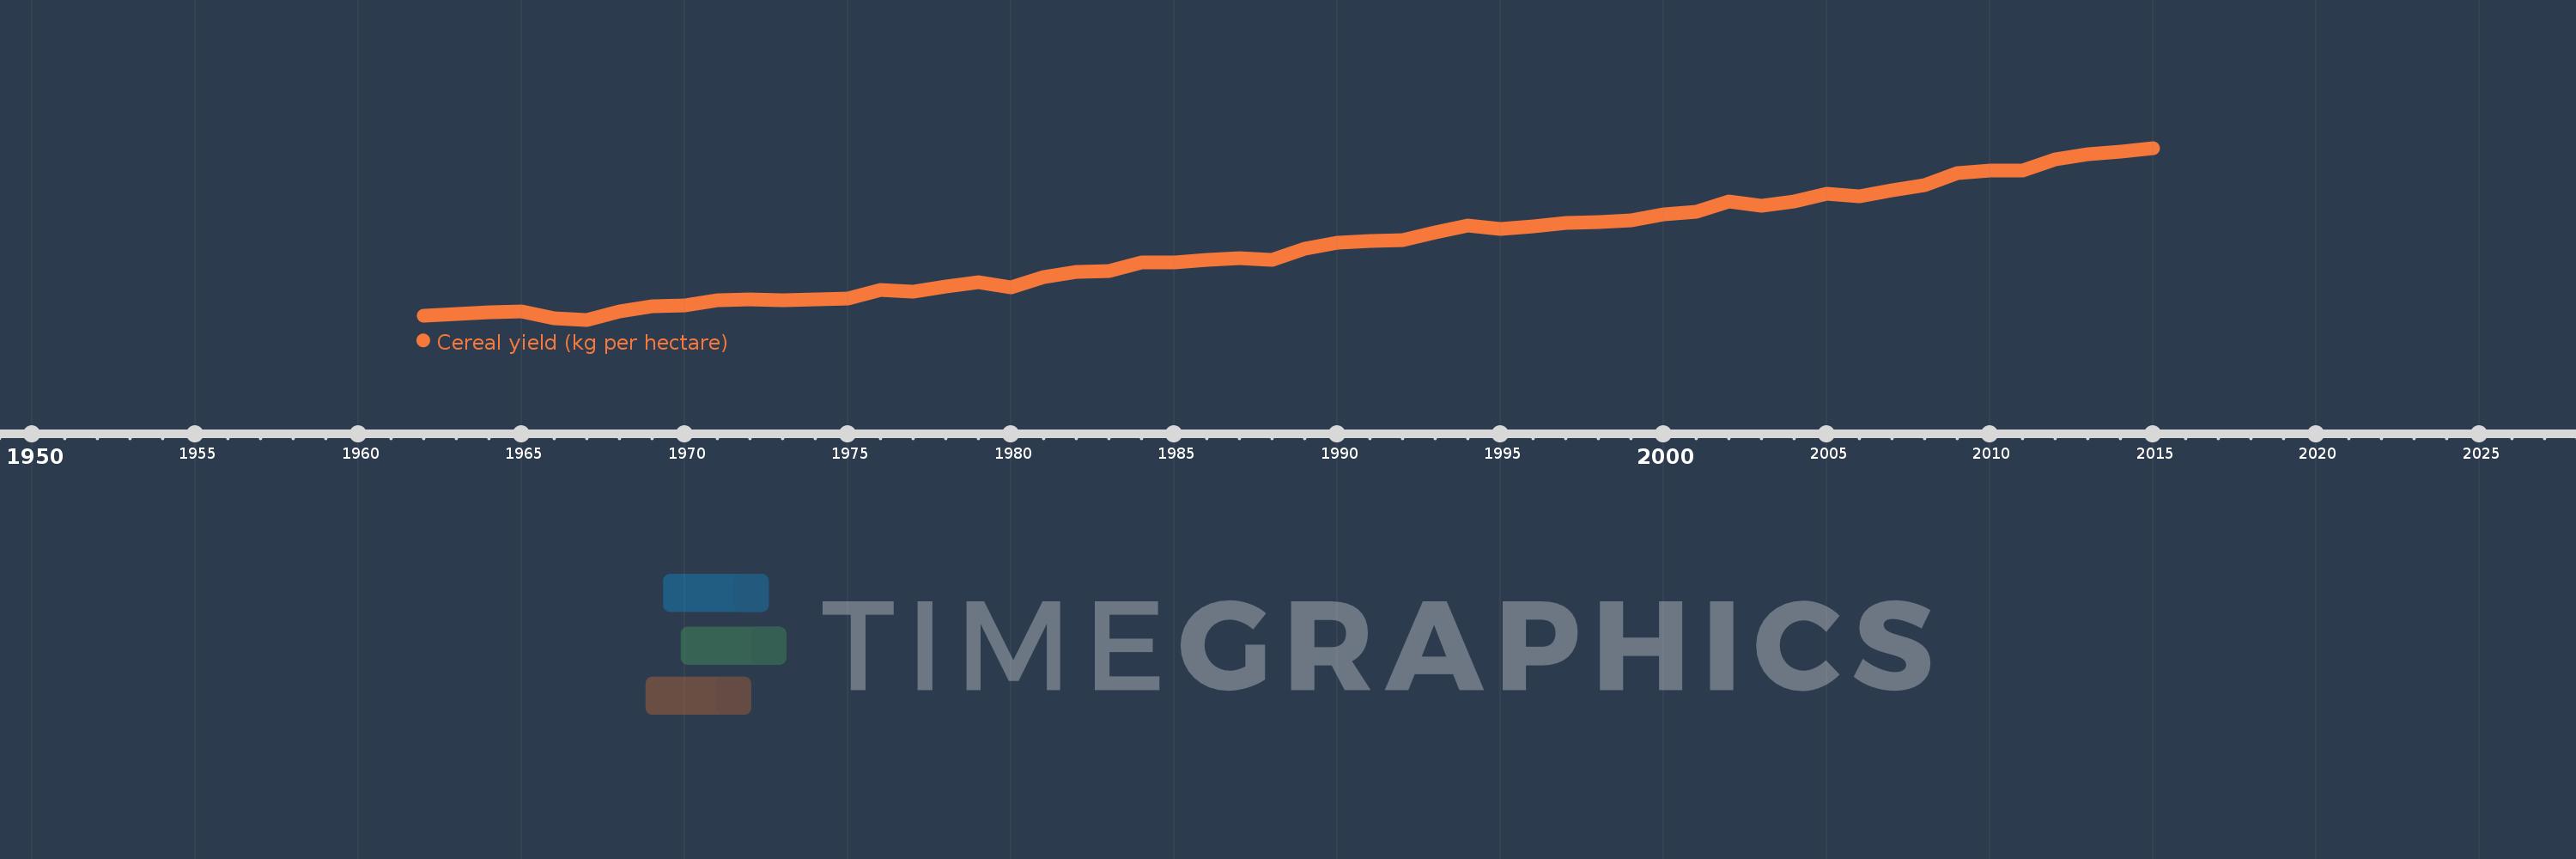
Cereal yield (kg per hectare)
2015,2014,2013,2012,2011,2010,2009,2008,2007,2006,2005,2004,2003,2002,2001,2000,1999,1998,1997,1996,1995,1994,1993,1992,1991,1990,1989,1988,1987,1986,1985,1984,1983,1982,1981,1980,1979,1978,1977,1976,1975,1974,1973,1972,1971,1970,1969,1968,1967,1966,1965,1964,1963,1962
This statistics in other country:
AfghanistanAlbaniaAlgeriaAngolaAntigua and BarbudaArab WorldArgentinaArmeniaAustraliaAustriaAzerbaijanBahamas, TheBangladeshBarbadosBelarusBelgiumBelizeBeninBhutanBoliviaBosnia and HerzegovinaBotswanaBrazilBrunei DarussalamBulgariaBurkina FasoBurundiCabo VerdeCambodiaCameroonCanadaCaribbean small statesCentral African RepublicCentral Europe and the BalticsChadChileChinaColombiaComorosCongo, Dem. Rep.Congo, Rep.Costa RicaCote d'IvoireCroatiaCubaCyprusCzech RepublicDenmarkDjiboutiDominicaDominican RepublicEarly-demographic dividendEast Asia & PacificEast Asia & Pacific (excluding high income)East Asia & Pacific (IDA & IBRD countries)EcuadorEgypt, Arab Rep.El SalvadorEritreaEstoniaEthiopiaEuro areaEurope & Central AsiaEurope & Central Asia (excluding high income)Europe & Central Asia (IDA & IBRD countries)European UnionFijiFinlandFragile and conflict affected situationsFranceGabonGambia, TheGeorgiaGermanyGhanaGreeceGrenadaGuamGuatemalaGuineaGuinea-BissauGuyanaHaitiHeavily indebted poor countries (HIPC)High incomeHondurasHong Kong SAR, ChinaHungaryIBRD onlyIDA & IBRD totalIDA blendIDA onlyIDA totalIndiaIndonesiaIran, Islamic Rep.IraqIrelandIsraelItalyJamaicaJapanJordanKazakhstanKenyaKorea, Dem. People’s Rep.Korea, Rep.KuwaitKyrgyz RepublicLao PDRLate-demographic dividendLatin America & Caribbean Latin America & Caribbean (excluding high income)Latin America & the Caribbean (IDA & IBRD countries)LatviaLeast developed countries: UN classificationLebanonLesothoLiberiaLibyaLithuaniaLow & middle incomeLow incomeLower middle incomeLuxembourgMacedonia, FYRMadagascarMalawiMalaysiaMaldivesMaliMaltaMauritaniaMauritiusMexicoMicronesia, Fed. Sts.Middle East & North AfricaMiddle East & North Africa (excluding high income)Middle East & North Africa (IDA & IBRD countries)Middle incomeMoldovaMongoliaMontenegroMoroccoMozambiqueMyanmarNamibiaNepalNetherlandsNew CaledoniaNew ZealandNicaraguaNigerNigeriaNorth AmericaNorwayOECD membersOmanOther small statesPacific island small statesPakistanPanamaPapua New GuineaParaguayPeruPhilippinesPolandPortugalPost-demographic dividendPre-demographic dividendPuerto RicoQatarRomaniaRussian FederationRwandaSao Tome and PrincipeSaudi ArabiaSenegalSerbiaSierra LeoneSlovak RepublicSloveniaSmall statesSolomon IslandsSomaliaSouth AfricaSouth AsiaSouth Asia (IDA & IBRD)South SudanSpainSri LankaSt. LuciaSt. Vincent and the GrenadinesSub-Saharan Africa Sub-Saharan Africa (excluding high income)Sub-Saharan Africa (IDA & IBRD countries)SudanSurinameSwazilandSwedenSwitzerlandSyrian Arab RepublicTajikistanTanzaniaThailandTimor-LesteTogoTrinidad and TobagoTunisiaTurkeyTurkmenistanUgandaUkraineUnited Arab EmiratesUnited KingdomUnited StatesUpper middle incomeUruguayUzbekistanVanuatuVenezuela, RBVietnamWest Bank and GazaWorldYemen, Rep.ZambiaZimbabwe Timeline:
This timeline shows a graph from 1962 to 2015 of Lower middle income. No data until 1961. Number of actual observations by date: 54.
Source name:
World Development Indicators
Source organization:
Food and Agriculture Organization, electronic files and web site.
Categories, topics:
Agriculture & Rural Development, Climate Change
Last updated:
apr 23, 2017
Indicators value changes by year
Minimum:
997.65
jan 1, 1967
Maximum:
3.185K
jan 1, 2015
At the date of observation
Value
Absolute change
Change from previous value
jan 1, 1962
1.047K
+1.047K
0.0%
jan 1, 1963
1.067K
+20.063
1.92%
jan 1, 1964
1.091K
+24.458
2.29%
jan 1, 1965
1.101K
+10.166
0.93%
jan 1, 1966
1.02K
-81.604
-7.41%
jan 1, 1967
997.65
-22.054
-2.16%
jan 1, 1968
1.104K
+106.777
10.7%
jan 1, 1969
1.175K
+70.358
6.37%
jan 1, 1970
1.175K
+0.387
0.03%
jan 1, 1971
1.241K
+66.132
5.63%
jan 1, 1972
1.252K
+10.566
0.85%
jan 1, 1973
1.243K
-8.665
-0.69%
jan 1, 1974
1.258K
+15.034
1.21%
jan 1, 1975
1.265K
+7.11
0.57%
jan 1, 1976
1.38K
+114.88
9.08%
jan 1, 1977
1.352K
-27.884
-2.02%
jan 1, 1978
1.422K
+69.862
5.17%
jan 1, 1979
1.474K
+51.612
3.63%
jan 1, 1980
1.412K
-61.347
-4.16%
jan 1, 1981
1.544K
+132.012
9.35%
jan 1, 1982
1.607K
+62.997
4.08%
jan 1, 1983
1.622K
+14.321
0.89%
jan 1, 1984
1.733K
+110.942
6.84%
jan 1, 1985
1.723K
-10.028
-0.58%
jan 1, 1986
1.759K
+35.803
2.08%
jan 1, 1987
1.785K
+26.365
1.5%
jan 1, 1988
1.758K
-27.067
-1.52%
jan 1, 1989
1.903K
+145.427
8.27%
jan 1, 1990
1.983K
+79.888
4.2%
jan 1, 1991
1.996K
+13.131
0.66%
jan 1, 1992
2.012K
+15.86
0.79%
jan 1, 1993
2.111K
+99.112
4.93%
jan 1, 1994
2.201K
+90.133
4.27%
jan 1, 1995
2.152K
-49.221
-2.24%
jan 1, 1996
2.186K
+33.407
1.55%
jan 1, 1997
2.235K
+49.446
2.26%
jan 1, 1998
2.243K
+8.115
0.36%
jan 1, 1999
2.268K
+24.771
1.1%
jan 1, 2000
2.343K
+75.479
3.33%
jan 1, 2001
2.375K
+31.946
1.36%
jan 1, 2002
2.502K
+126.881
5.34%
jan 1, 2003
2.444K
-57.915
-2.31%
jan 1, 2004
2.504K
+59.571
2.44%
jan 1, 2005
2.603K
+98.907
3.95%
jan 1, 2006
2.575K
-28.01
-1.08%
jan 1, 2007
2.65K
+75.09
2.92%
jan 1, 2008
2.711K
+60.76
2.29%
jan 1, 2009
2.869K
+158.864
5.86%
jan 1, 2010
2.894K
+24.89
0.87%
jan 1, 2011
2.902K
+7.844
0.27%
jan 1, 2012
3.036K
+134.202
4.62%
jan 1, 2013
3.103K
+66.321
2.18%
jan 1, 2014
3.135K
+32.746
1.06%
jan 1, 2015
3.185K
+49.993
1.59%
Ranking of countries by current statistics by years


Comments: