29
/
en
AIzaSyAYiBZKx7MnpbEhh9jyipgxe19OcubqV5w
April 1, 2024
25533
Central Europe and the Baltics
CEB
false
2
1
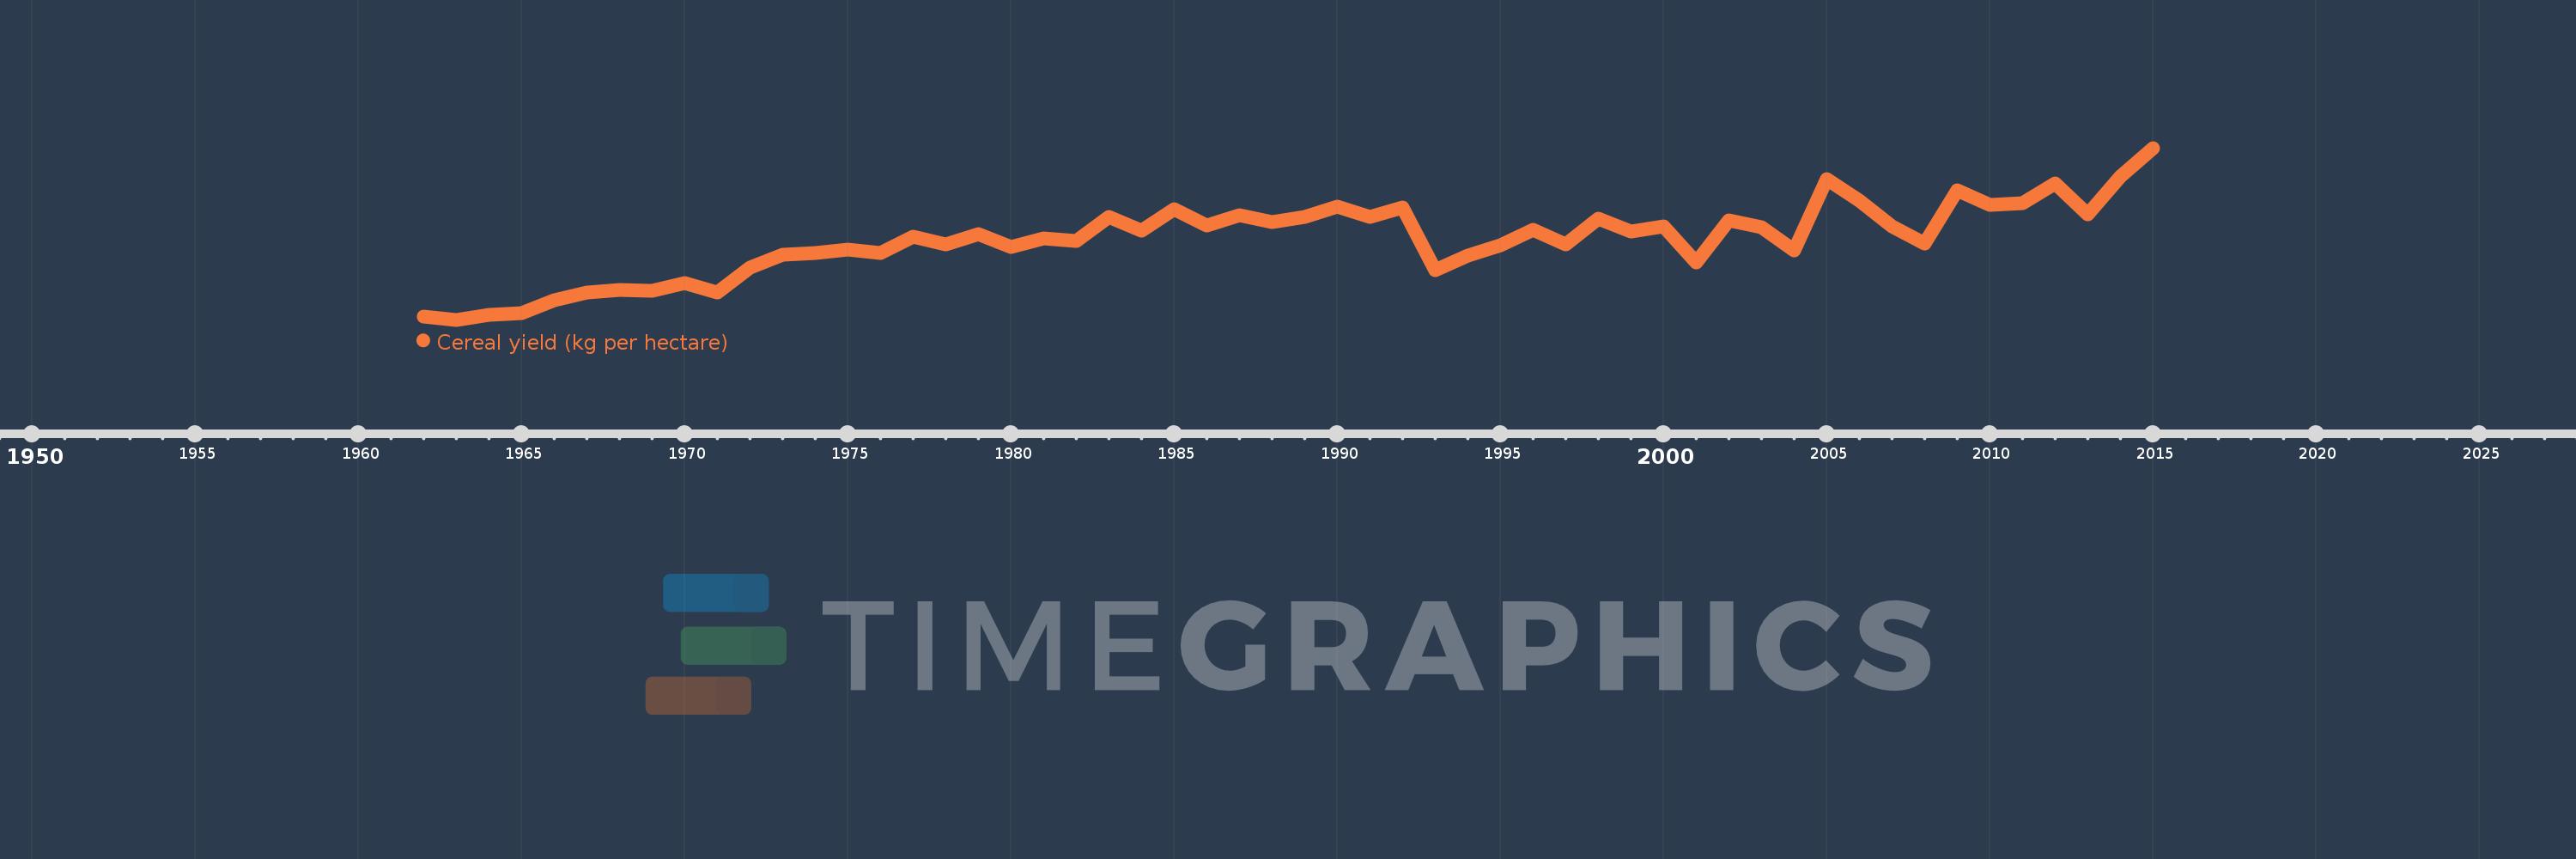
Cereal yield (kg per hectare)
2015,2014,2013,2012,2011,2010,2009,2008,2007,2006,2005,2004,2003,2002,2001,2000,1999,1998,1997,1996,1995,1994,1993,1992,1991,1990,1989,1988,1987,1986,1985,1984,1983,1982,1981,1980,1979,1978,1977,1976,1975,1974,1973,1972,1971,1970,1969,1968,1967,1966,1965,1964,1963,1962
This statistics in other country:
AfghanistanAlbaniaAlgeriaAngolaAntigua and BarbudaArab WorldArgentinaArmeniaAustraliaAustriaAzerbaijanBahamas, TheBangladeshBarbadosBelarusBelgiumBelizeBeninBhutanBoliviaBosnia and HerzegovinaBotswanaBrazilBrunei DarussalamBulgariaBurkina FasoBurundiCabo VerdeCambodiaCameroonCanadaCaribbean small statesCentral African RepublicCentral Europe and the BalticsChadChileChinaColombiaComorosCongo, Dem. Rep.Congo, Rep.Costa RicaCote d'IvoireCroatiaCubaCyprusCzech RepublicDenmarkDjiboutiDominicaDominican RepublicEarly-demographic dividendEast Asia & PacificEast Asia & Pacific (excluding high income)East Asia & Pacific (IDA & IBRD countries)EcuadorEgypt, Arab Rep.El SalvadorEritreaEstoniaEthiopiaEuro areaEurope & Central AsiaEurope & Central Asia (excluding high income)Europe & Central Asia (IDA & IBRD countries)European UnionFijiFinlandFragile and conflict affected situationsFranceGabonGambia, TheGeorgiaGermanyGhanaGreeceGrenadaGuamGuatemalaGuineaGuinea-BissauGuyanaHaitiHeavily indebted poor countries (HIPC)High incomeHondurasHong Kong SAR, ChinaHungaryIBRD onlyIDA & IBRD totalIDA blendIDA onlyIDA totalIndiaIndonesiaIran, Islamic Rep.IraqIrelandIsraelItalyJamaicaJapanJordanKazakhstanKenyaKorea, Dem. People’s Rep.Korea, Rep.KuwaitKyrgyz RepublicLao PDRLate-demographic dividendLatin America & Caribbean Latin America & Caribbean (excluding high income)Latin America & the Caribbean (IDA & IBRD countries)LatviaLeast developed countries: UN classificationLebanonLesothoLiberiaLibyaLithuaniaLow & middle incomeLow incomeLower middle incomeLuxembourgMacedonia, FYRMadagascarMalawiMalaysiaMaldivesMaliMaltaMauritaniaMauritiusMexicoMicronesia, Fed. Sts.Middle East & North AfricaMiddle East & North Africa (excluding high income)Middle East & North Africa (IDA & IBRD countries)Middle incomeMoldovaMongoliaMontenegroMoroccoMozambiqueMyanmarNamibiaNepalNetherlandsNew CaledoniaNew ZealandNicaraguaNigerNigeriaNorth AmericaNorwayOECD membersOmanOther small statesPacific island small statesPakistanPanamaPapua New GuineaParaguayPeruPhilippinesPolandPortugalPost-demographic dividendPre-demographic dividendPuerto RicoQatarRomaniaRussian FederationRwandaSao Tome and PrincipeSaudi ArabiaSenegalSerbiaSierra LeoneSlovak RepublicSloveniaSmall statesSolomon IslandsSomaliaSouth AfricaSouth AsiaSouth Asia (IDA & IBRD)South SudanSpainSri LankaSt. LuciaSt. Vincent and the GrenadinesSub-Saharan Africa Sub-Saharan Africa (excluding high income)Sub-Saharan Africa (IDA & IBRD countries)SudanSurinameSwazilandSwedenSwitzerlandSyrian Arab RepublicTajikistanTanzaniaThailandTimor-LesteTogoTrinidad and TobagoTunisiaTurkeyTurkmenistanUgandaUkraineUnited Arab EmiratesUnited KingdomUnited StatesUpper middle incomeUruguayUzbekistanVanuatuVenezuela, RBVietnamWest Bank and GazaWorldYemen, Rep.ZambiaZimbabwe Timeline:
This timeline shows a graph from 1962 to 2015 of Central Europe and the Baltics. No data until 1961. Number of actual observations by date: 54.
Source name:
World Development Indicators
Source organization:
Food and Agriculture Organization, electronic files and web site.
Categories, topics:
Agriculture & Rural Development, Climate Change
Last updated:
apr 23, 2017
Indicators value changes by year
Minimum:
1.649K
jan 1, 1963
Maximum:
4.657K
jan 1, 2015
At the date of observation
Value
Absolute change
Change from previous value
jan 1, 1962
1.702K
+1.702K
0.0%
jan 1, 1963
1.649K
-53.29
-3.13%
jan 1, 1964
1.731K
+81.905
4.97%
jan 1, 1965
1.763K
+32.146
1.86%
jan 1, 1966
1.997K
+234.122
13.28%
jan 1, 1967
2.132K
+134.9
6.75%
jan 1, 1968
2.168K
+35.607
1.67%
jan 1, 1969
2.162K
-5.694
-0.26%
jan 1, 1970
2.286K
+124.422
5.76%
jan 1, 1971
2.127K
-159.674
-6.98%
jan 1, 1972
2.568K
+441.082
20.74%
jan 1, 1973
2.791K
+223.429
8.7%
jan 1, 1974
2.82K
+29.245
1.05%
jan 1, 1975
2.877K
+56.778
2.01%
jan 1, 1976
2.81K
-66.786
-2.32%
jan 1, 1977
3.107K
+297.051
10.57%
jan 1, 1978
2.962K
-145.256
-4.67%
jan 1, 1979
3.144K
+182.144
6.15%
jan 1, 1980
2.917K
-227.306
-7.23%
jan 1, 1981
3.077K
+159.443
5.47%
jan 1, 1982
3.021K
-55.138
-1.79%
jan 1, 1983
3.45K
+428.533
14.18%
jan 1, 1984
3.201K
-248.781
-7.21%
jan 1, 1985
3.578K
+376.897
11.77%
jan 1, 1986
3.303K
-275.499
-7.7%
jan 1, 1987
3.479K
+176.087
5.33%
jan 1, 1988
3.357K
-121.965
-3.51%
jan 1, 1989
3.446K
+89.461
2.67%
jan 1, 1990
3.625K
+179.374
5.21%
jan 1, 1991
3.455K
-170.906
-4.71%
jan 1, 1992
3.614K
+159.785
4.63%
jan 1, 1993
2.516K
-1.098K
-30.39%
jan 1, 1994
2.773K
+257.239
10.22%
jan 1, 1995
2.945K
+172.024
6.2%
jan 1, 1996
3.227K
+281.66
9.56%
jan 1, 1997
2.971K
-255.526
-7.92%
jan 1, 1998
3.413K
+441.416
14.86%
jan 1, 1999
3.187K
-226.25
-6.63%
jan 1, 2000
3.289K
+102.336
3.21%
jan 1, 2001
2.646K
-642.617
-19.54%
jan 1, 2002
3.389K
+742.649
28.06%
jan 1, 2003
3.27K
-119.391
-3.52%
jan 1, 2004
2.861K
-408.267
-12.49%
jan 1, 2005
4.117K
+1.255K
43.87%
jan 1, 2006
3.741K
-375.711
-9.13%
jan 1, 2007
3.285K
-455.593
-12.18%
jan 1, 2008
2.979K
-306.563
-9.33%
jan 1, 2009
3.912K
+933.228
31.33%
jan 1, 2010
3.663K
-249.315
-6.37%
jan 1, 2011
3.694K
+31.296
0.85%
jan 1, 2012
4.04K
+346.474
9.38%
jan 1, 2013
3.493K
-547.723
-13.56%
jan 1, 2014
4.15K
+656.987
18.81%
jan 1, 2015
4.657K
+507.11
12.22%
Ranking of countries by current statistics by years


Comments: