29
/
en
AIzaSyAYiBZKx7MnpbEhh9jyipgxe19OcubqV5w
April 1, 2024
27111
East Asia & Pacific
EAS
false
2
1
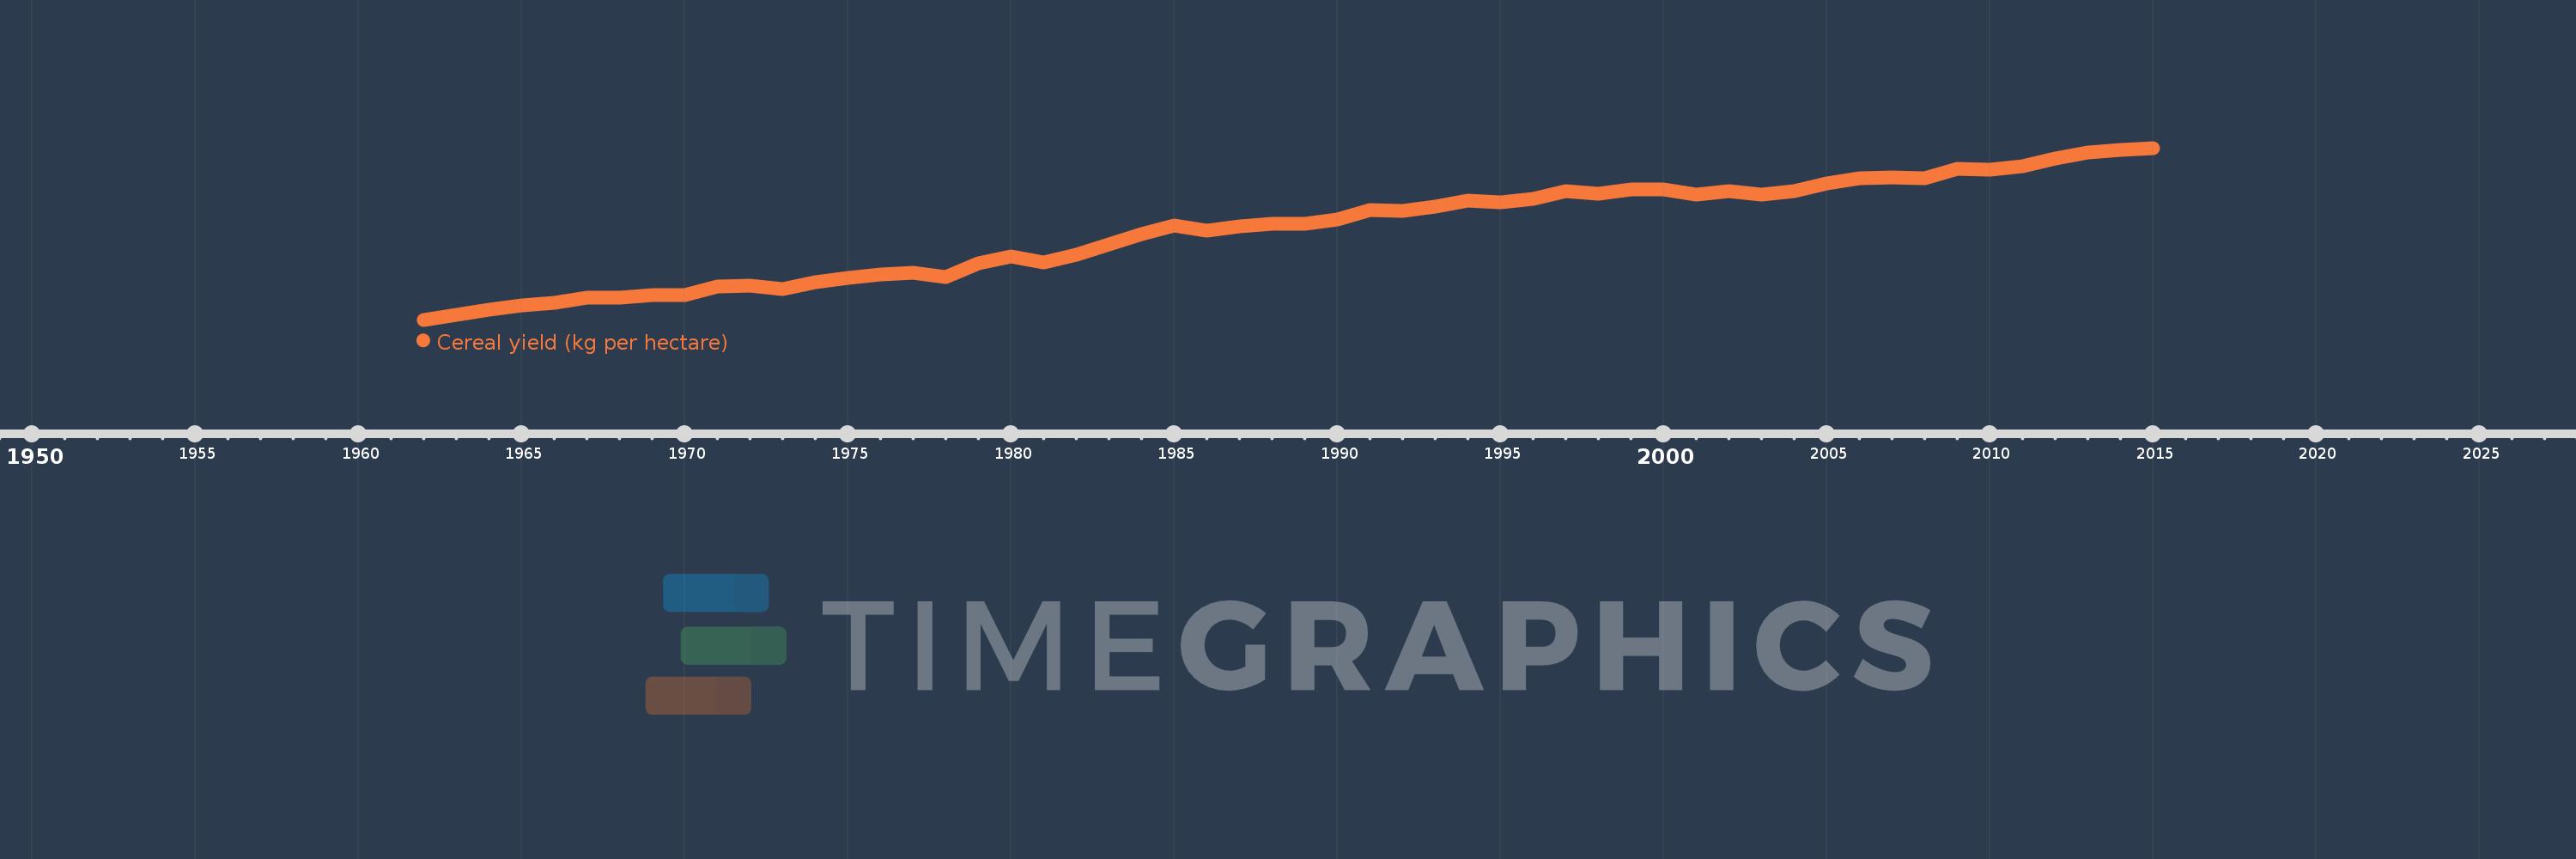
Cereal yield (kg per hectare)
2015,2014,2013,2012,2011,2010,2009,2008,2007,2006,2005,2004,2003,2002,2001,2000,1999,1998,1997,1996,1995,1994,1993,1992,1991,1990,1989,1988,1987,1986,1985,1984,1983,1982,1981,1980,1979,1978,1977,1976,1975,1974,1973,1972,1971,1970,1969,1968,1967,1966,1965,1964,1963,1962
This statistics in other country:
AfghanistanAlbaniaAlgeriaAngolaAntigua and BarbudaArab WorldArgentinaArmeniaAustraliaAustriaAzerbaijanBahamas, TheBangladeshBarbadosBelarusBelgiumBelizeBeninBhutanBoliviaBosnia and HerzegovinaBotswanaBrazilBrunei DarussalamBulgariaBurkina FasoBurundiCabo VerdeCambodiaCameroonCanadaCaribbean small statesCentral African RepublicCentral Europe and the BalticsChadChileChinaColombiaComorosCongo, Dem. Rep.Congo, Rep.Costa RicaCote d'IvoireCroatiaCubaCyprusCzech RepublicDenmarkDjiboutiDominicaDominican RepublicEarly-demographic dividendEast Asia & PacificEast Asia & Pacific (excluding high income)East Asia & Pacific (IDA & IBRD countries)EcuadorEgypt, Arab Rep.El SalvadorEritreaEstoniaEthiopiaEuro areaEurope & Central AsiaEurope & Central Asia (excluding high income)Europe & Central Asia (IDA & IBRD countries)European UnionFijiFinlandFragile and conflict affected situationsFranceGabonGambia, TheGeorgiaGermanyGhanaGreeceGrenadaGuamGuatemalaGuineaGuinea-BissauGuyanaHaitiHeavily indebted poor countries (HIPC)High incomeHondurasHong Kong SAR, ChinaHungaryIBRD onlyIDA & IBRD totalIDA blendIDA onlyIDA totalIndiaIndonesiaIran, Islamic Rep.IraqIrelandIsraelItalyJamaicaJapanJordanKazakhstanKenyaKorea, Dem. People’s Rep.Korea, Rep.KuwaitKyrgyz RepublicLao PDRLate-demographic dividendLatin America & Caribbean Latin America & Caribbean (excluding high income)Latin America & the Caribbean (IDA & IBRD countries)LatviaLeast developed countries: UN classificationLebanonLesothoLiberiaLibyaLithuaniaLow & middle incomeLow incomeLower middle incomeLuxembourgMacedonia, FYRMadagascarMalawiMalaysiaMaldivesMaliMaltaMauritaniaMauritiusMexicoMicronesia, Fed. Sts.Middle East & North AfricaMiddle East & North Africa (excluding high income)Middle East & North Africa (IDA & IBRD countries)Middle incomeMoldovaMongoliaMontenegroMoroccoMozambiqueMyanmarNamibiaNepalNetherlandsNew CaledoniaNew ZealandNicaraguaNigerNigeriaNorth AmericaNorwayOECD membersOmanOther small statesPacific island small statesPakistanPanamaPapua New GuineaParaguayPeruPhilippinesPolandPortugalPost-demographic dividendPre-demographic dividendPuerto RicoQatarRomaniaRussian FederationRwandaSao Tome and PrincipeSaudi ArabiaSenegalSerbiaSierra LeoneSlovak RepublicSloveniaSmall statesSolomon IslandsSomaliaSouth AfricaSouth AsiaSouth Asia (IDA & IBRD)South SudanSpainSri LankaSt. LuciaSt. Vincent and the GrenadinesSub-Saharan Africa Sub-Saharan Africa (excluding high income)Sub-Saharan Africa (IDA & IBRD countries)SudanSurinameSwazilandSwedenSwitzerlandSyrian Arab RepublicTajikistanTanzaniaThailandTimor-LesteTogoTrinidad and TobagoTunisiaTurkeyTurkmenistanUgandaUkraineUnited Arab EmiratesUnited KingdomUnited StatesUpper middle incomeUruguayUzbekistanVanuatuVenezuela, RBVietnamWest Bank and GazaWorldYemen, Rep.ZambiaZimbabwe Timeline:
This timeline shows a graph from 1962 to 2015 of East Asia & Pacific. No data until 1961. Number of actual observations by date: 54.
Source name:
World Development Indicators
Source organization:
Food and Agriculture Organization, electronic files and web site.
Categories, topics:
Agriculture & Rural Development, Climate Change
Last updated:
apr 23, 2017
Indicators value changes by year
Minimum:
1.416K
jan 1, 1962
Maximum:
4.958K
jan 1, 2015
At the date of observation
Value
Absolute change
Change from previous value
jan 1, 1962
1.416K
+1.416K
0.0%
jan 1, 1963
1.513K
+97.043
6.85%
jan 1, 1964
1.629K
+115.92
7.66%
jan 1, 1965
1.711K
+82.206
5.05%
jan 1, 1966
1.759K
+48.29
2.82%
jan 1, 1967
1.865K
+105.832
6.02%
jan 1, 1968
1.874K
+9.238
0.5%
jan 1, 1969
1.925K
+51.009
2.72%
jan 1, 1970
1.92K
-5.101
-0.26%
jan 1, 1971
2.099K
+178.38
9.29%
jan 1, 1972
2.117K
+18.832
0.9%
jan 1, 1973
2.048K
-69.021
-3.26%
jan 1, 1974
2.193K
+144.581
7.06%
jan 1, 1975
2.283K
+89.955
4.1%
jan 1, 1976
2.348K
+64.556
2.83%
jan 1, 1977
2.383K
+35.021
1.49%
jan 1, 1978
2.303K
-79.588
-3.34%
jan 1, 1979
2.571K
+267.99
11.64%
jan 1, 1980
2.714K
+142.923
5.56%
jan 1, 1981
2.604K
-109.406
-4.03%
jan 1, 1982
2.756K
+151.096
5.8%
jan 1, 1983
2.964K
+208.8
7.58%
jan 1, 1984
3.176K
+211.568
7.14%
jan 1, 1985
3.355K
+179.283
5.65%
jan 1, 1986
3.26K
-95.12
-2.83%
jan 1, 1987
3.335K
+75.178
2.31%
jan 1, 1988
3.392K
+57.183
1.71%
jan 1, 1989
3.389K
-3.874
-0.11%
jan 1, 1990
3.478K
+89.249
2.63%
jan 1, 1991
3.675K
+197.026
5.67%
jan 1, 1992
3.663K
-11.932
-0.32%
jan 1, 1993
3.756K
+93.169
2.54%
jan 1, 1994
3.867K
+110.909
2.95%
jan 1, 1995
3.83K
-37.478
-0.97%
jan 1, 1996
3.911K
+81.813
2.14%
jan 1, 1997
4.073K
+162.127
4.15%
jan 1, 1998
4.023K
-50.737
-1.25%
jan 1, 1999
4.094K
+71.659
1.78%
jan 1, 2000
4.109K
+14.483
0.35%
jan 1, 2001
4.001K
-107.958
-2.63%
jan 1, 2002
4.062K
+61.012
1.52%
jan 1, 2003
4.004K
-57.663
-1.42%
jan 1, 2004
4.07K
+66.202
1.65%
jan 1, 2005
4.229K
+159.007
3.91%
jan 1, 2006
4.34K
+110.574
2.61%
jan 1, 2007
4.352K
+11.661
0.27%
jan 1, 2008
4.331K
-20.531
-0.47%
jan 1, 2009
4.529K
+198.097
4.57%
jan 1, 2010
4.504K
-24.96
-0.55%
jan 1, 2011
4.574K
+69.302
1.54%
jan 1, 2012
4.749K
+175.085
3.83%
jan 1, 2013
4.868K
+119.569
2.52%
jan 1, 2014
4.914K
+45.282
0.93%
jan 1, 2015
4.958K
+44.906
0.91%
Ranking of countries by current statistics by years


Comments: