29
/
en
AIzaSyAYiBZKx7MnpbEhh9jyipgxe19OcubqV5w
April 1, 2024
37187
IDA & IBRD total
IBT
false
2
1
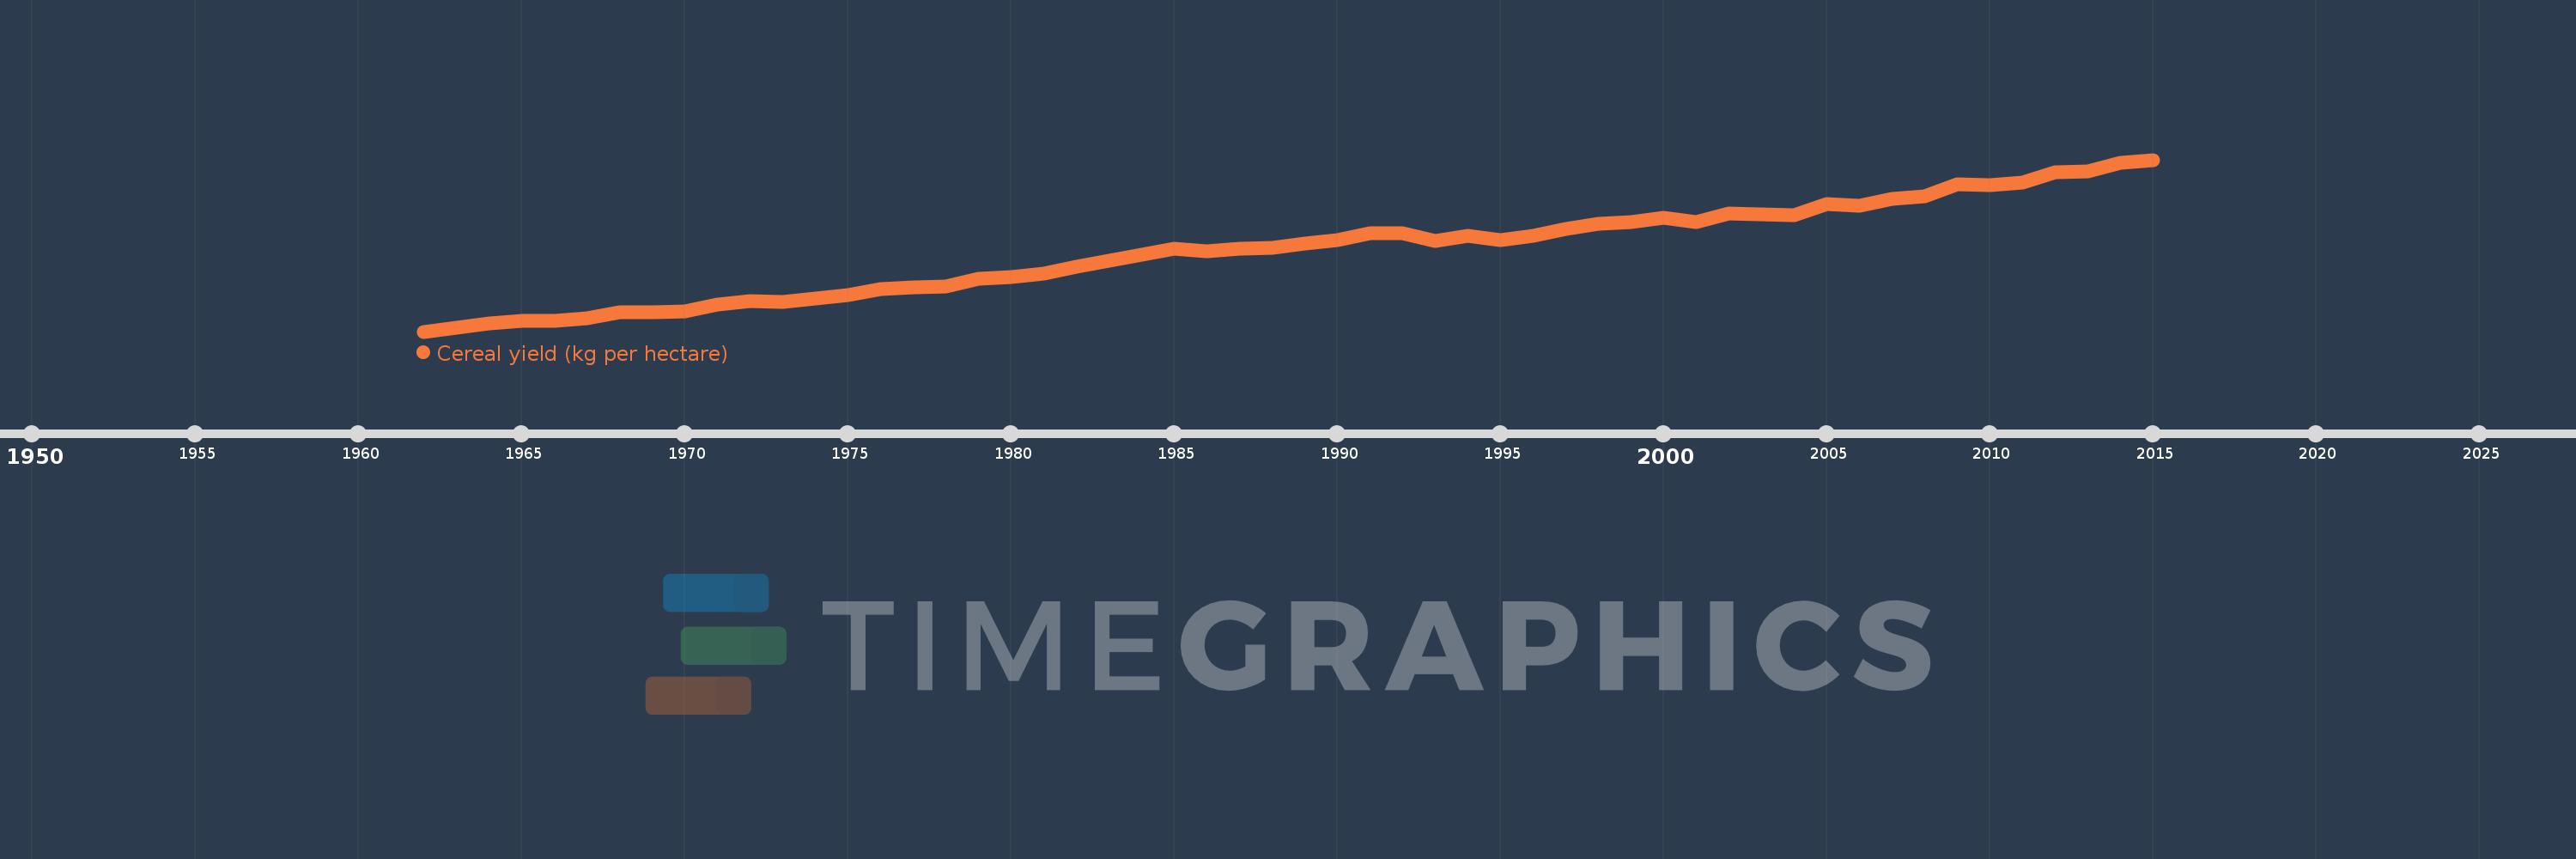
Cereal yield (kg per hectare)
2015,2014,2013,2012,2011,2010,2009,2008,2007,2006,2005,2004,2003,2002,2001,2000,1999,1998,1997,1996,1995,1994,1993,1992,1991,1990,1989,1988,1987,1986,1985,1984,1983,1982,1981,1980,1979,1978,1977,1976,1975,1974,1973,1972,1971,1970,1969,1968,1967,1966,1965,1964,1963,1962
This statistics in other country:
AfghanistanAlbaniaAlgeriaAngolaAntigua and BarbudaArab WorldArgentinaArmeniaAustraliaAustriaAzerbaijanBahamas, TheBangladeshBarbadosBelarusBelgiumBelizeBeninBhutanBoliviaBosnia and HerzegovinaBotswanaBrazilBrunei DarussalamBulgariaBurkina FasoBurundiCabo VerdeCambodiaCameroonCanadaCaribbean small statesCentral African RepublicCentral Europe and the BalticsChadChileChinaColombiaComorosCongo, Dem. Rep.Congo, Rep.Costa RicaCote d'IvoireCroatiaCubaCyprusCzech RepublicDenmarkDjiboutiDominicaDominican RepublicEarly-demographic dividendEast Asia & PacificEast Asia & Pacific (excluding high income)East Asia & Pacific (IDA & IBRD countries)EcuadorEgypt, Arab Rep.El SalvadorEritreaEstoniaEthiopiaEuro areaEurope & Central AsiaEurope & Central Asia (excluding high income)Europe & Central Asia (IDA & IBRD countries)European UnionFijiFinlandFragile and conflict affected situationsFranceGabonGambia, TheGeorgiaGermanyGhanaGreeceGrenadaGuamGuatemalaGuineaGuinea-BissauGuyanaHaitiHeavily indebted poor countries (HIPC)High incomeHondurasHong Kong SAR, ChinaHungaryIBRD onlyIDA & IBRD totalIDA blendIDA onlyIDA totalIndiaIndonesiaIran, Islamic Rep.IraqIrelandIsraelItalyJamaicaJapanJordanKazakhstanKenyaKorea, Dem. People’s Rep.Korea, Rep.KuwaitKyrgyz RepublicLao PDRLate-demographic dividendLatin America & Caribbean Latin America & Caribbean (excluding high income)Latin America & the Caribbean (IDA & IBRD countries)LatviaLeast developed countries: UN classificationLebanonLesothoLiberiaLibyaLithuaniaLow & middle incomeLow incomeLower middle incomeLuxembourgMacedonia, FYRMadagascarMalawiMalaysiaMaldivesMaliMaltaMauritaniaMauritiusMexicoMicronesia, Fed. Sts.Middle East & North AfricaMiddle East & North Africa (excluding high income)Middle East & North Africa (IDA & IBRD countries)Middle incomeMoldovaMongoliaMontenegroMoroccoMozambiqueMyanmarNamibiaNepalNetherlandsNew CaledoniaNew ZealandNicaraguaNigerNigeriaNorth AmericaNorwayOECD membersOmanOther small statesPacific island small statesPakistanPanamaPapua New GuineaParaguayPeruPhilippinesPolandPortugalPost-demographic dividendPre-demographic dividendPuerto RicoQatarRomaniaRussian FederationRwandaSao Tome and PrincipeSaudi ArabiaSenegalSerbiaSierra LeoneSlovak RepublicSloveniaSmall statesSolomon IslandsSomaliaSouth AfricaSouth AsiaSouth Asia (IDA & IBRD)South SudanSpainSri LankaSt. LuciaSt. Vincent and the GrenadinesSub-Saharan Africa Sub-Saharan Africa (excluding high income)Sub-Saharan Africa (IDA & IBRD countries)SudanSurinameSwazilandSwedenSwitzerlandSyrian Arab RepublicTajikistanTanzaniaThailandTimor-LesteTogoTrinidad and TobagoTunisiaTurkeyTurkmenistanUgandaUkraineUnited Arab EmiratesUnited KingdomUnited StatesUpper middle incomeUruguayUzbekistanVanuatuVenezuela, RBVietnamWest Bank and GazaWorldYemen, Rep.ZambiaZimbabwe Timeline:
This timeline shows a graph from 1962 to 2015 of IDA & IBRD total. No data until 1961. Number of actual observations by date: 54.
Source name:
World Development Indicators
Source organization:
Food and Agriculture Organization, electronic files and web site.
Categories, topics:
Agriculture & Rural Development, Climate Change
Last updated:
apr 23, 2017
Indicators value changes by year
Minimum:
1.121K
jan 1, 1962
At the date of observation
Value
Absolute change
Change from previous value
jan 1, 1962
1.121K
+1.121K
0.0%
jan 1, 1963
1.17K
+49.117
4.38%
jan 1, 1964
1.233K
+62.784
5.37%
jan 1, 1965
1.266K
+33.446
2.71%
jan 1, 1966
1.264K
-2.523
-0.2%
jan 1, 1967
1.302K
+38.587
3.05%
jan 1, 1968
1.378K
+76.226
5.85%
jan 1, 1969
1.381K
+2.546
0.18%
jan 1, 1970
1.39K
+8.612
0.62%
jan 1, 1971
1.479K
+89.54
6.44%
jan 1, 1972
1.532K
+52.793
3.57%
jan 1, 1973
1.516K
-15.471
-1.01%
jan 1, 1974
1.558K
+41.23
2.72%
jan 1, 1975
1.613K
+54.961
3.53%
jan 1, 1976
1.69K
+77.792
4.82%
jan 1, 1977
1.706K
+15.96
0.94%
jan 1, 1978
1.721K
+14.567
0.85%
jan 1, 1979
1.831K
+109.561
6.37%
jan 1, 1980
1.849K
+18.807
1.03%
jan 1, 1981
1.894K
+44.368
2.4%
jan 1, 1982
1.98K
+85.96
4.54%
jan 1, 1983
2.068K
+88.703
4.48%
jan 1, 1984
2.148K
+79.831
3.86%
jan 1, 1985
2.229K
+80.687
3.76%
jan 1, 1986
2.197K
-32.01
-1.44%
jan 1, 1987
2.224K
+27.004
1.23%
jan 1, 1988
2.236K
+12.568
0.57%
jan 1, 1989
2.29K
+53.204
2.38%
jan 1, 1990
2.346K
+56.045
2.45%
jan 1, 1991
2.427K
+80.923
3.45%
jan 1, 1992
2.433K
+6.405
0.26%
jan 1, 1993
2.332K
-101.014
-4.15%
jan 1, 1994
2.398K
+65.579
2.81%
jan 1, 1995
2.345K
-52.108
-2.17%
jan 1, 1996
2.396K
+50.112
2.14%
jan 1, 1997
2.493K
+97.553
4.07%
jan 1, 1998
2.554K
+60.517
2.43%
jan 1, 1999
2.586K
+32.422
1.27%
jan 1, 2000
2.642K
+55.962
2.16%
jan 1, 2001
2.578K
-63.569
-2.41%
jan 1, 2002
2.698K
+119.635
4.64%
jan 1, 2003
2.684K
-14.283
-0.53%
jan 1, 2004
2.675K
-8.906
-0.33%
jan 1, 2005
2.817K
+142.306
5.32%
jan 1, 2006
2.803K
-13.998
-0.5%
jan 1, 2007
2.891K
+88.254
3.15%
jan 1, 2008
2.928K
+36.58
1.27%
jan 1, 2009
3.09K
+161.705
5.52%
jan 1, 2010
3.075K
-14.91
-0.48%
jan 1, 2011
3.107K
+32.271
1.05%
jan 1, 2012
3.24K
+133.053
4.28%
jan 1, 2013
3.26K
+20.032
0.62%
jan 1, 2014
3.371K
+110.6
3.39%
jan 1, 2015
3.41K
+39.594
1.17%
Ranking of countries by current statistics by years


Comments: