29
/
en
AIzaSyAYiBZKx7MnpbEhh9jyipgxe19OcubqV5w
April 1, 2024
82879
Belize
BLZ
true
2
1
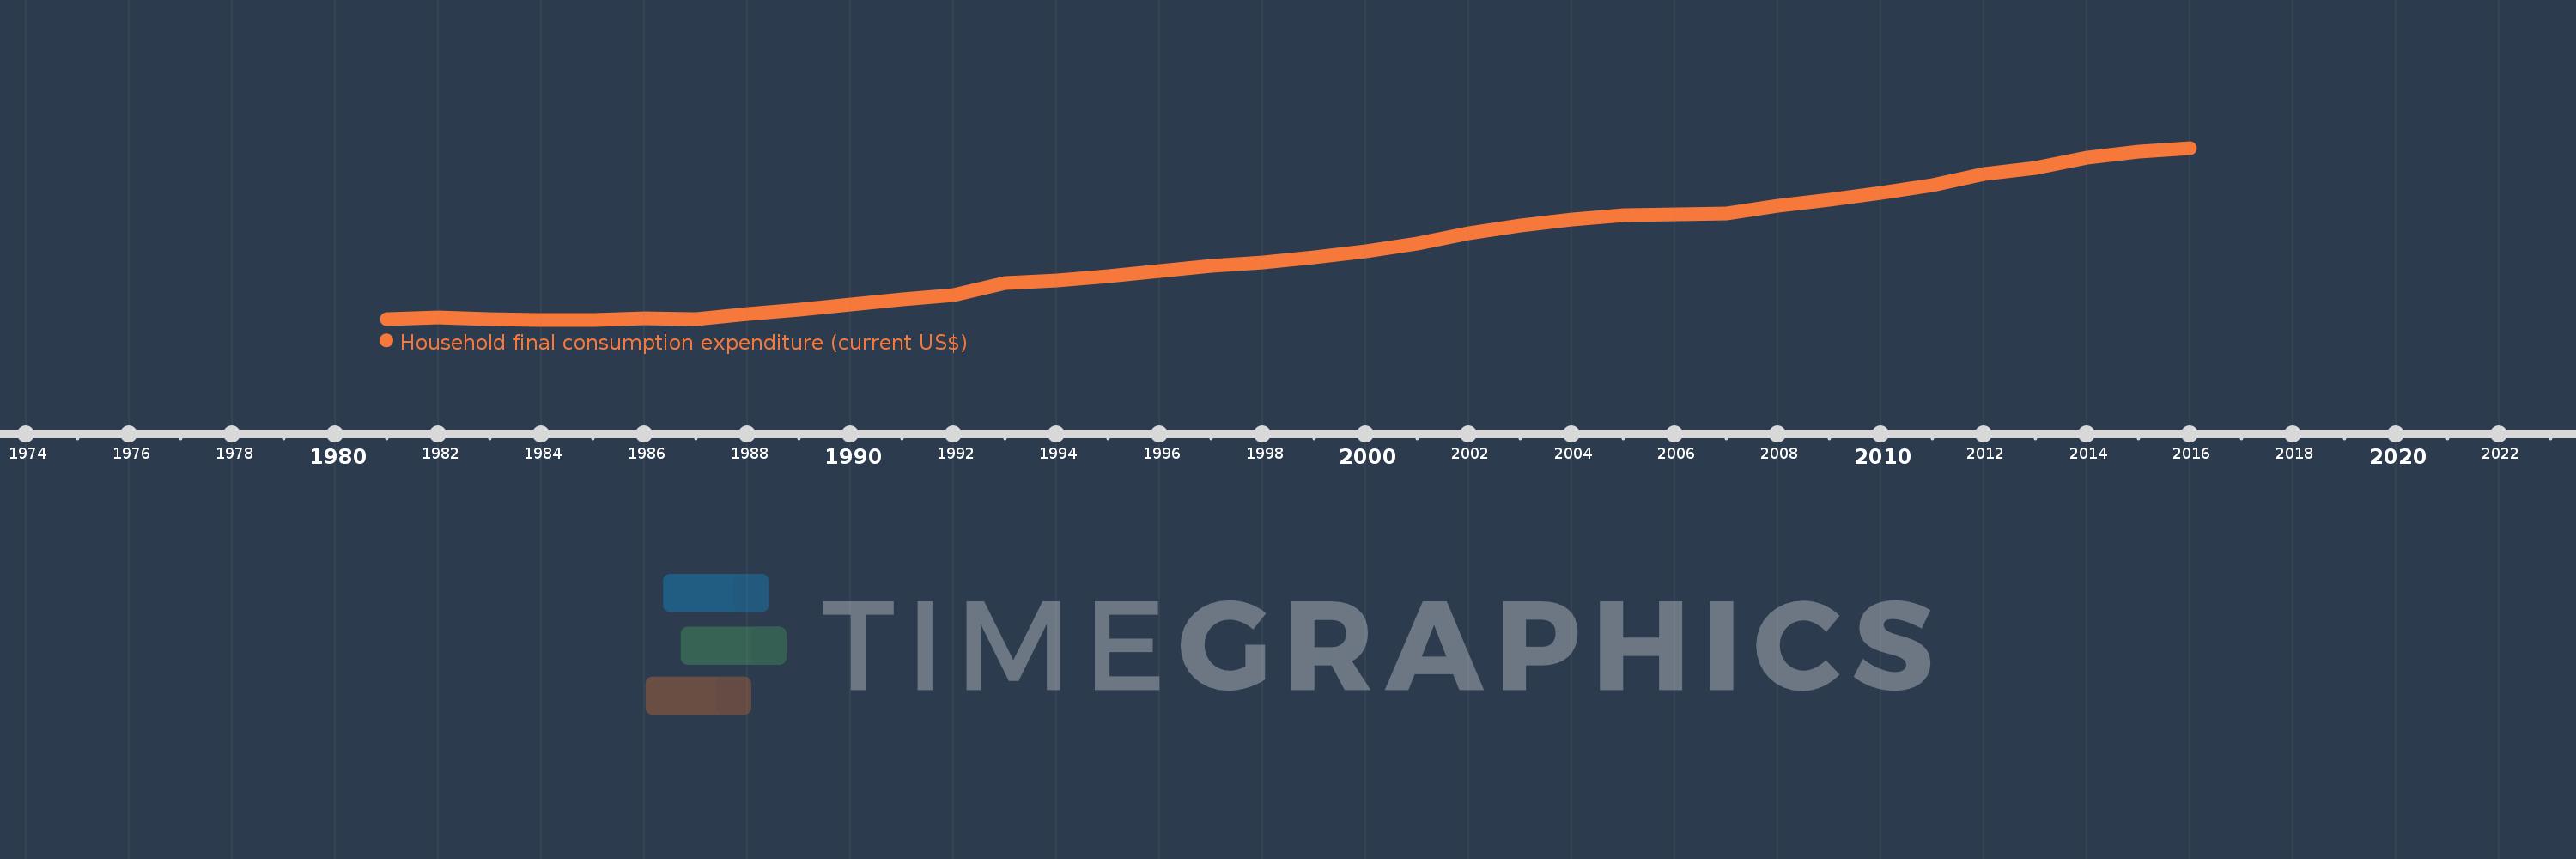
Household final consumption expenditure (current US$)
2016,2015,2014,2013,2012,2011,2010,2009,2008,2007,2006,2005,2004,2003,2002,2001,2000,1999,1998,1997,1996,1995,1994,1993,1992,1991,1990,1989,1988,1987,1986,1985,1984,1983,1982,1981
This statistics in other country:
AfghanistanAlbaniaAlgeriaAngolaAntigua and BarbudaArab WorldArgentinaArmeniaArubaAustraliaAustriaAzerbaijanBahamas, TheBahrainBangladeshBarbadosBelarusBelgiumBelizeBeninBermudaBhutanBoliviaBosnia and HerzegovinaBotswanaBrazilBrunei DarussalamBulgariaBurkina FasoBurundiCabo VerdeCambodiaCameroonCanadaCaribbean small statesCentral African RepublicCentral Europe and the BalticsChadChileChinaColombiaComorosCongo, Dem. Rep.Congo, Rep.Costa RicaCote d'IvoireCroatiaCubaCyprusCzech RepublicDenmarkDjiboutiDominicaDominican RepublicEarly-demographic dividendEast Asia & PacificEast Asia & Pacific (excluding high income)East Asia & Pacific (IDA & IBRD countries)EcuadorEgypt, Arab Rep.El SalvadorEquatorial GuineaEritreaEstoniaEthiopiaEuro areaEurope & Central AsiaEurope & Central Asia (excluding high income)Europe & Central Asia (IDA & IBRD countries)European UnionFaroe IslandsFijiFinlandFranceGabonGambia, TheGeorgiaGermanyGhanaGreeceGrenadaGuatemalaGuineaGuinea-BissauGuyanaHaitiHeavily indebted poor countries (HIPC)High incomeHondurasHong Kong SAR, ChinaHungaryIBRD onlyIcelandIDA & IBRD totalIDA blendIDA onlyIDA totalIndiaIndonesiaIran, Islamic Rep.IrelandIsraelItalyJamaicaJapanJordanKazakhstanKenyaKiribatiKorea, Rep.KosovoKuwaitKyrgyz RepublicLao PDRLate-demographic dividendLatin America & Caribbean Latin America & Caribbean (excluding high income)Latin America & the Caribbean (IDA & IBRD countries)LatviaLeast developed countries: UN classificationLebanonLesothoLiberiaLibyaLithuaniaLow & middle incomeLow incomeLower middle incomeLuxembourgMacao SAR, ChinaMacedonia, FYRMadagascarMalawiMalaysiaMaliMaltaMauritaniaMauritiusMexicoMicronesia, Fed. Sts.Middle East & North AfricaMiddle East & North Africa (excluding high income)Middle East & North Africa (IDA & IBRD countries)Middle incomeMoldovaMongoliaMontenegroMoroccoMozambiqueNamibiaNepalNetherlandsNew CaledoniaNew ZealandNicaraguaNigerNigeriaNorth AmericaNorwayOECD membersOmanOther small statesPakistanPanamaPapua New GuineaParaguayPeruPhilippinesPolandPortugalPost-demographic dividendPre-demographic dividendPuerto RicoQatarRomaniaRussian FederationRwandaSaudi ArabiaSenegalSerbiaSeychellesSierra LeoneSingaporeSlovak RepublicSloveniaSmall statesSolomon IslandsSomaliaSouth AfricaSouth AsiaSouth Asia (IDA & IBRD)South SudanSpainSri LankaSt. Kitts and NevisSt. LuciaSt. Vincent and the GrenadinesSub-Saharan Africa Sub-Saharan Africa (excluding high income)Sub-Saharan Africa (IDA & IBRD countries)SudanSurinameSwazilandSwedenSwitzerlandSyrian Arab RepublicTajikistanTanzaniaThailandTimor-LesteTogoTongaTrinidad and TobagoTunisiaTurkeyTurkmenistanUgandaUkraineUnited Arab EmiratesUnited KingdomUnited StatesUpper middle incomeUruguayUzbekistanVanuatuVenezuela, RBVietnamWest Bank and GazaWorldYemen, Rep.ZambiaZimbabwe Timeline:
This timeline shows a graph from 1981 to 2016 of Belize. No data until 1980. Number of actual observations by date: 36.
Source name:
World Development Indicators
Source organization:
World Bank national accounts data, and OECD National Accounts data files.
Categories, topics:
Economy & Growth
Last updated:
apr 23, 2017
Indicators value changes by year
Minimum:
135.75 mln
jan 1, 1985
Maximum:
1.224 bln
jan 1, 2016
At the date of observation
Value
Absolute change
Change from previous value
jan 1, 1981
140.1 mln
+140.1 mln
0.0%
jan 1, 1982
148.3 mln
+8.2 mln
5.85%
jan 1, 1983
140.45 mln
-7.85 mln
-5.29%
jan 1, 1984
136.05 mln
-4.4 mln
-3.13%
jan 1, 1985
135.75 mln
-300.0K
-0.22%
jan 1, 1986
146.6 mln
+10.85 mln
7.99%
jan 1, 1987
140.7 mln
-5.9 mln
-4.02%
jan 1, 1988
172.4 mln
+31.7 mln
22.53%
jan 1, 1989
201.15 mln
+28.75 mln
16.68%
jan 1, 1990
232.05 mln
+30.9 mln
15.36%
jan 1, 1991
266.8 mln
+34.75 mln
14.98%
jan 1, 1992
291.25 mln
+24.45 mln
9.16%
jan 1, 1993
369.787 mln
+78.537 mln
26.97%
jan 1, 1994
382.191 mln
+12.404 mln
3.35%
jan 1, 1995
412.072 mln
+29.881 mln
7.82%
jan 1, 1996
445.652 mln
+33.58 mln
8.15%
jan 1, 1997
478.449 mln
+32.796 mln
7.36%
jan 1, 1998
497.176 mln
+18.727 mln
3.91%
jan 1, 1999
533.526 mln
+36.35 mln
7.31%
jan 1, 2000
567.191 mln
+33.665 mln
6.31%
jan 1, 2001
616.5 mln
+49.309 mln
8.69%
jan 1, 2002
681.513 mln
+65.013 mln
10.55%
jan 1, 2003
732.706 mln
+51.194 mln
7.51%
jan 1, 2004
768.919 mln
+36.213 mln
4.94%
jan 1, 2005
795.868 mln
+26.95 mln
3.5%
jan 1, 2006
801.805 mln
+5.936 mln
0.75%
jan 1, 2007
806.754 mln
+4.949 mln
0.62%
jan 1, 2008
855.376 mln
+48.623 mln
6.03%
jan 1, 2009
894.5 mln
+39.123 mln
4.57%
jan 1, 2010
939.252 mln
+44.752 mln
5.0%
jan 1, 2011
990.056 mln
+50.805 mln
5.41%
jan 1, 2012
1.058 bln
+67.637 mln
6.83%
jan 1, 2013
1.099 bln
+41.359 mln
3.91%
jan 1, 2014
1.162 bln
+63.408 mln
5.77%
jan 1, 2015
1.2 bln
+37.08 mln
3.19%
jan 1, 2016
1.224 bln
+24.439 mln
2.04%
Ranking of countries by current statistics by years


Comments: