29
/
en
AIzaSyAYiBZKx7MnpbEhh9jyipgxe19OcubqV5w
April 1, 2024
182174
Luxembourg
LUX
true
2
1
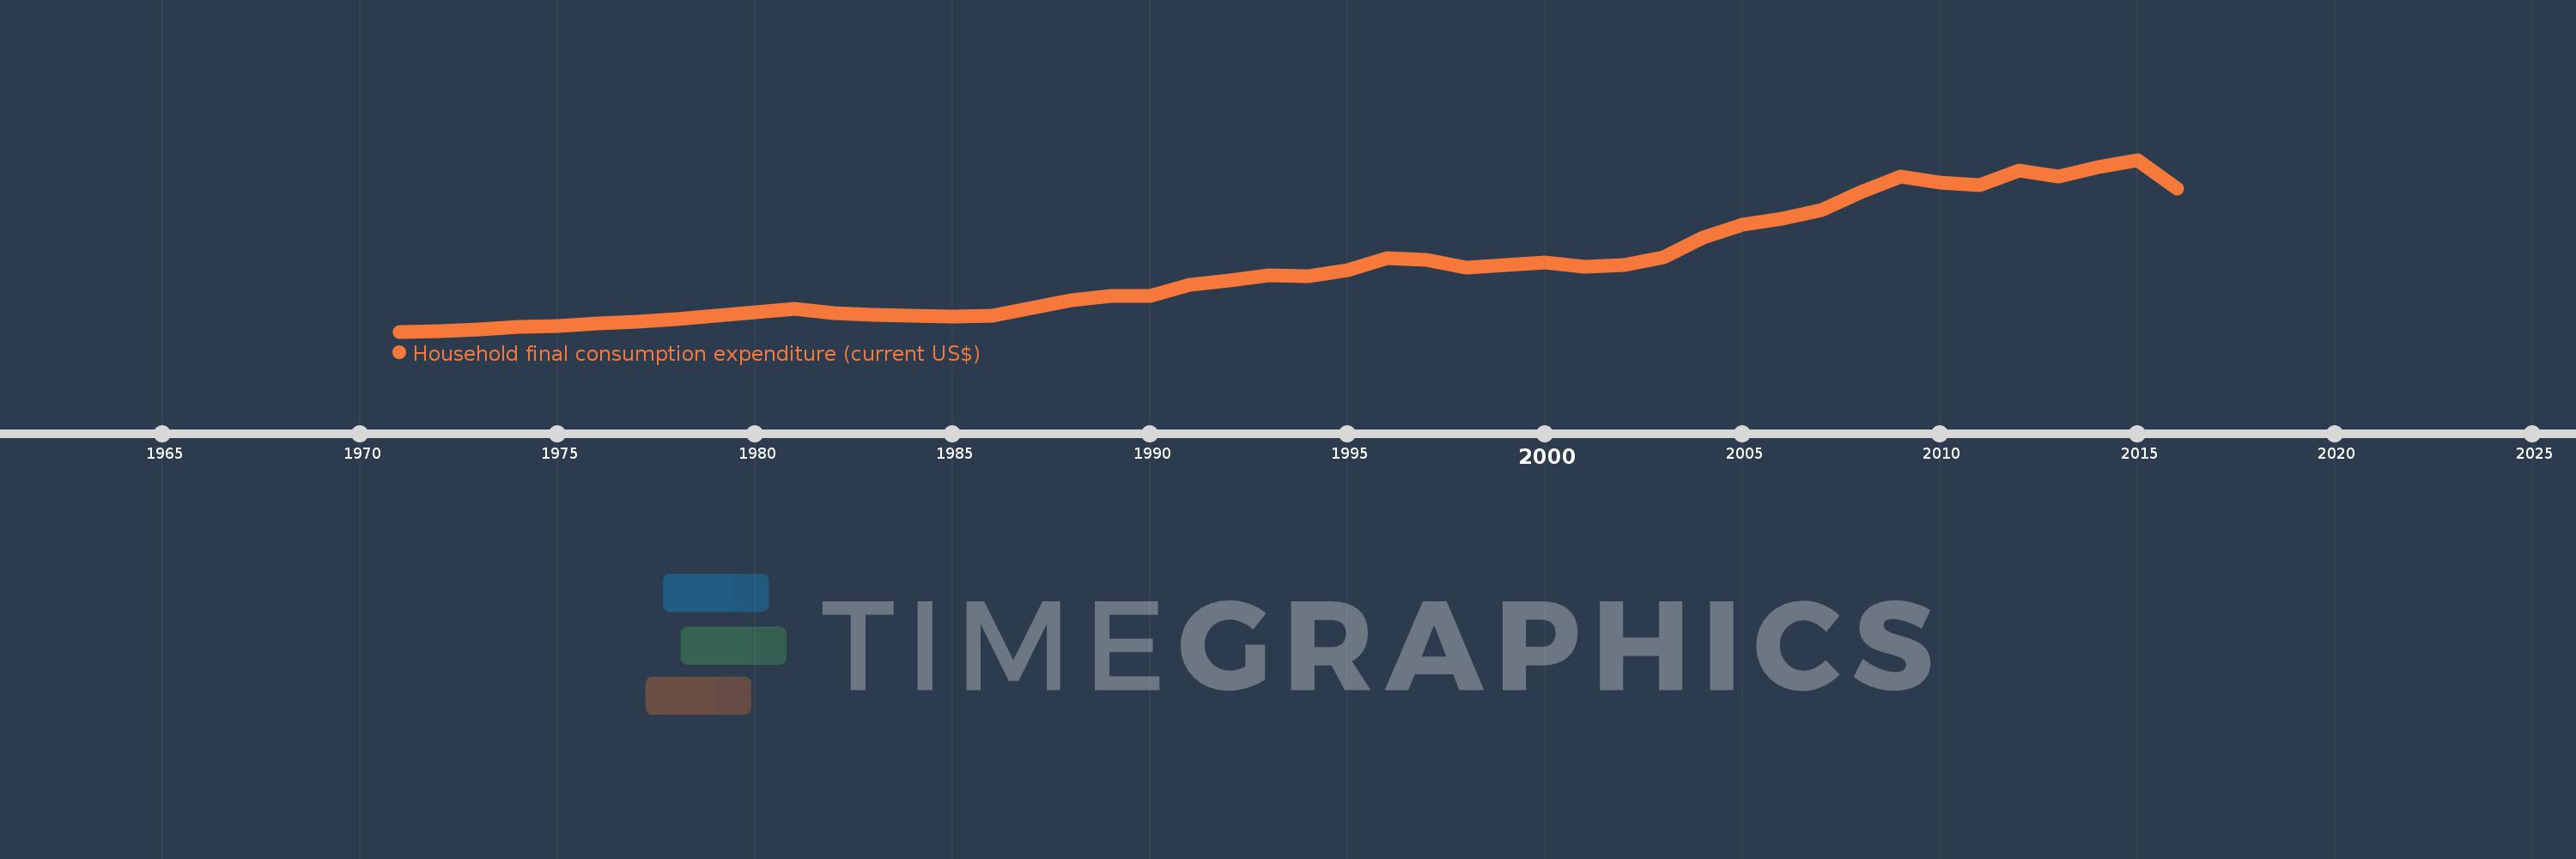
Household final consumption expenditure (current US$)
2016,2015,2014,2013,2012,2011,2010,2009,2008,2007,2006,2005,2004,2003,2002,2001,2000,1999,1998,1997,1996,1995,1994,1993,1992,1991,1990,1989,1988,1987,1986,1985,1984,1983,1982,1981,1980,1979,1978,1977,1976,1975,1974,1973,1972,1971
This statistics in other country:
AfghanistanAlbaniaAlgeriaAngolaAntigua and BarbudaArab WorldArgentinaArmeniaArubaAustraliaAustriaAzerbaijanBahamas, TheBahrainBangladeshBarbadosBelarusBelgiumBelizeBeninBermudaBhutanBoliviaBosnia and HerzegovinaBotswanaBrazilBrunei DarussalamBulgariaBurkina FasoBurundiCabo VerdeCambodiaCameroonCanadaCaribbean small statesCentral African RepublicCentral Europe and the BalticsChadChileChinaColombiaComorosCongo, Dem. Rep.Congo, Rep.Costa RicaCote d'IvoireCroatiaCubaCyprusCzech RepublicDenmarkDjiboutiDominicaDominican RepublicEarly-demographic dividendEast Asia & PacificEast Asia & Pacific (excluding high income)East Asia & Pacific (IDA & IBRD countries)EcuadorEgypt, Arab Rep.El SalvadorEquatorial GuineaEritreaEstoniaEthiopiaEuro areaEurope & Central AsiaEurope & Central Asia (excluding high income)Europe & Central Asia (IDA & IBRD countries)European UnionFaroe IslandsFijiFinlandFranceGabonGambia, TheGeorgiaGermanyGhanaGreeceGrenadaGuatemalaGuineaGuinea-BissauGuyanaHaitiHeavily indebted poor countries (HIPC)High incomeHondurasHong Kong SAR, ChinaHungaryIBRD onlyIcelandIDA & IBRD totalIDA blendIDA onlyIDA totalIndiaIndonesiaIran, Islamic Rep.IrelandIsraelItalyJamaicaJapanJordanKazakhstanKenyaKiribatiKorea, Rep.KosovoKuwaitKyrgyz RepublicLao PDRLate-demographic dividendLatin America & Caribbean Latin America & Caribbean (excluding high income)Latin America & the Caribbean (IDA & IBRD countries)LatviaLeast developed countries: UN classificationLebanonLesothoLiberiaLibyaLithuaniaLow & middle incomeLow incomeLower middle incomeLuxembourgMacao SAR, ChinaMacedonia, FYRMadagascarMalawiMalaysiaMaliMaltaMauritaniaMauritiusMexicoMicronesia, Fed. Sts.Middle East & North AfricaMiddle East & North Africa (excluding high income)Middle East & North Africa (IDA & IBRD countries)Middle incomeMoldovaMongoliaMontenegroMoroccoMozambiqueNamibiaNepalNetherlandsNew CaledoniaNew ZealandNicaraguaNigerNigeriaNorth AmericaNorwayOECD membersOmanOther small statesPakistanPanamaPapua New GuineaParaguayPeruPhilippinesPolandPortugalPost-demographic dividendPre-demographic dividendPuerto RicoQatarRomaniaRussian FederationRwandaSaudi ArabiaSenegalSerbiaSeychellesSierra LeoneSingaporeSlovak RepublicSloveniaSmall statesSolomon IslandsSomaliaSouth AfricaSouth AsiaSouth Asia (IDA & IBRD)South SudanSpainSri LankaSt. Kitts and NevisSt. LuciaSt. Vincent and the GrenadinesSub-Saharan Africa Sub-Saharan Africa (excluding high income)Sub-Saharan Africa (IDA & IBRD countries)SudanSurinameSwazilandSwedenSwitzerlandSyrian Arab RepublicTajikistanTanzaniaThailandTimor-LesteTogoTongaTrinidad and TobagoTunisiaTurkeyTurkmenistanUgandaUkraineUnited Arab EmiratesUnited KingdomUnited StatesUpper middle incomeUruguayUzbekistanVanuatuVenezuela, RBVietnamWest Bank and GazaWorldYemen, Rep.ZambiaZimbabwe Timeline:
This timeline shows a graph from 1971 to 2016 of Luxembourg. No data until 1970. Number of actual observations by date: 46.
Source name:
World Development Indicators
Source organization:
World Bank national accounts data, and OECD National Accounts data files.
Categories, topics:
Economy & Growth
Last updated:
apr 23, 2017
Indicators value changes by year
Minimum:
673.623 mln
jan 1, 1971
Maximum:
20.251 bln
jan 1, 2015
At the date of observation
Value
Absolute change
Change from previous value
jan 1, 1971
673.623 mln
+673.623 mln
0.0%
jan 1, 1972
761.898 mln
+88.276 mln
13.1%
jan 1, 1973
932.152 mln
+170.253 mln
22.35%
jan 1, 1974
1.167 bln
+235.225 mln
25.23%
jan 1, 1975
1.343 bln
+175.768 mln
15.06%
jan 1, 1976
1.651 bln
+307.753 mln
22.91%
jan 1, 1977
1.773 bln
+122.257 mln
7.41%
jan 1, 1978
2.065 bln
+291.817 mln
16.46%
jan 1, 1979
2.501 bln
+436.353 mln
21.13%
jan 1, 1980
2.919 bln
+417.973 mln
16.71%
jan 1, 1981
3.235 bln
+315.721 mln
10.81%
jan 1, 1982
2.814 bln
-420.658 mln
-13.0%
jan 1, 1983
2.539 bln
-275.279 mln
-9.78%
jan 1, 1984
2.468 bln
-70.636 mln
-2.78%
jan 1, 1985
2.361 bln
-107.593 mln
-4.36%
jan 1, 1986
2.466 bln
+104.705 mln
4.44%
jan 1, 1987
3.395 bln
+929.809 mln
37.71%
jan 1, 1988
4.286 bln
+890.488 mln
26.23%
jan 1, 1989
4.716 bln
+430.2 mln
10.04%
jan 1, 1990
4.763 bln
+47.057 mln
1.0%
jan 1, 1991
6.04 bln
+1.277 bln
26.81%
jan 1, 1992
6.539 bln
+498.926 mln
8.26%
jan 1, 1993
7.071 bln
+531.856 mln
8.13%
jan 1, 1994
6.973 bln
-97.551 mln
-1.38%
jan 1, 1995
7.698 bln
+725.121 mln
10.4%
jan 1, 1996
9.078 bln
+1.38 bln
17.92%
jan 1, 1997
8.803 bln
-274.513 mln
-3.02%
jan 1, 1998
8.003 bln
-800.694 mln
-9.1%
jan 1, 1999
8.286 bln
+283.621 mln
3.54%
jan 1, 2000
8.532 bln
+245.633 mln
2.96%
jan 1, 2001
8.049 bln
-483.532 mln
-5.67%
jan 1, 2002
8.223 bln
+174.65 mln
2.17%
jan 1, 2003
9.162 bln
+938.596 mln
11.41%
jan 1, 2004
11.405 bln
+2.243 bln
24.49%
jan 1, 2005
12.903 bln
+1.498 bln
13.13%
jan 1, 2006
13.559 bln
+656.229 mln
5.09%
jan 1, 2007
14.482 bln
+923.115 mln
6.81%
jan 1, 2008
16.542 bln
+2.06 bln
14.22%
jan 1, 2009
18.344 bln
+1.801 bln
10.89%
jan 1, 2010
17.681 bln
-662.613 mln
-3.61%
jan 1, 2011
17.317 bln
-364.069 mln
-2.06%
jan 1, 2012
19.039 bln
+1.723 bln
9.95%
jan 1, 2013
18.378 bln
-661.58 mln
-3.47%
jan 1, 2014
19.413 bln
+1.035 bln
5.63%
jan 1, 2015
20.251 bln
+838.502 mln
4.32%
jan 1, 2016
16.994 bln
-3.257 bln
-16.08%
Ranking of countries by current statistics by years


Comments: