29
/
en
AIzaSyAYiBZKx7MnpbEhh9jyipgxe19OcubqV5w
April 1, 2024
46170
Low income
LIC
false
2
1
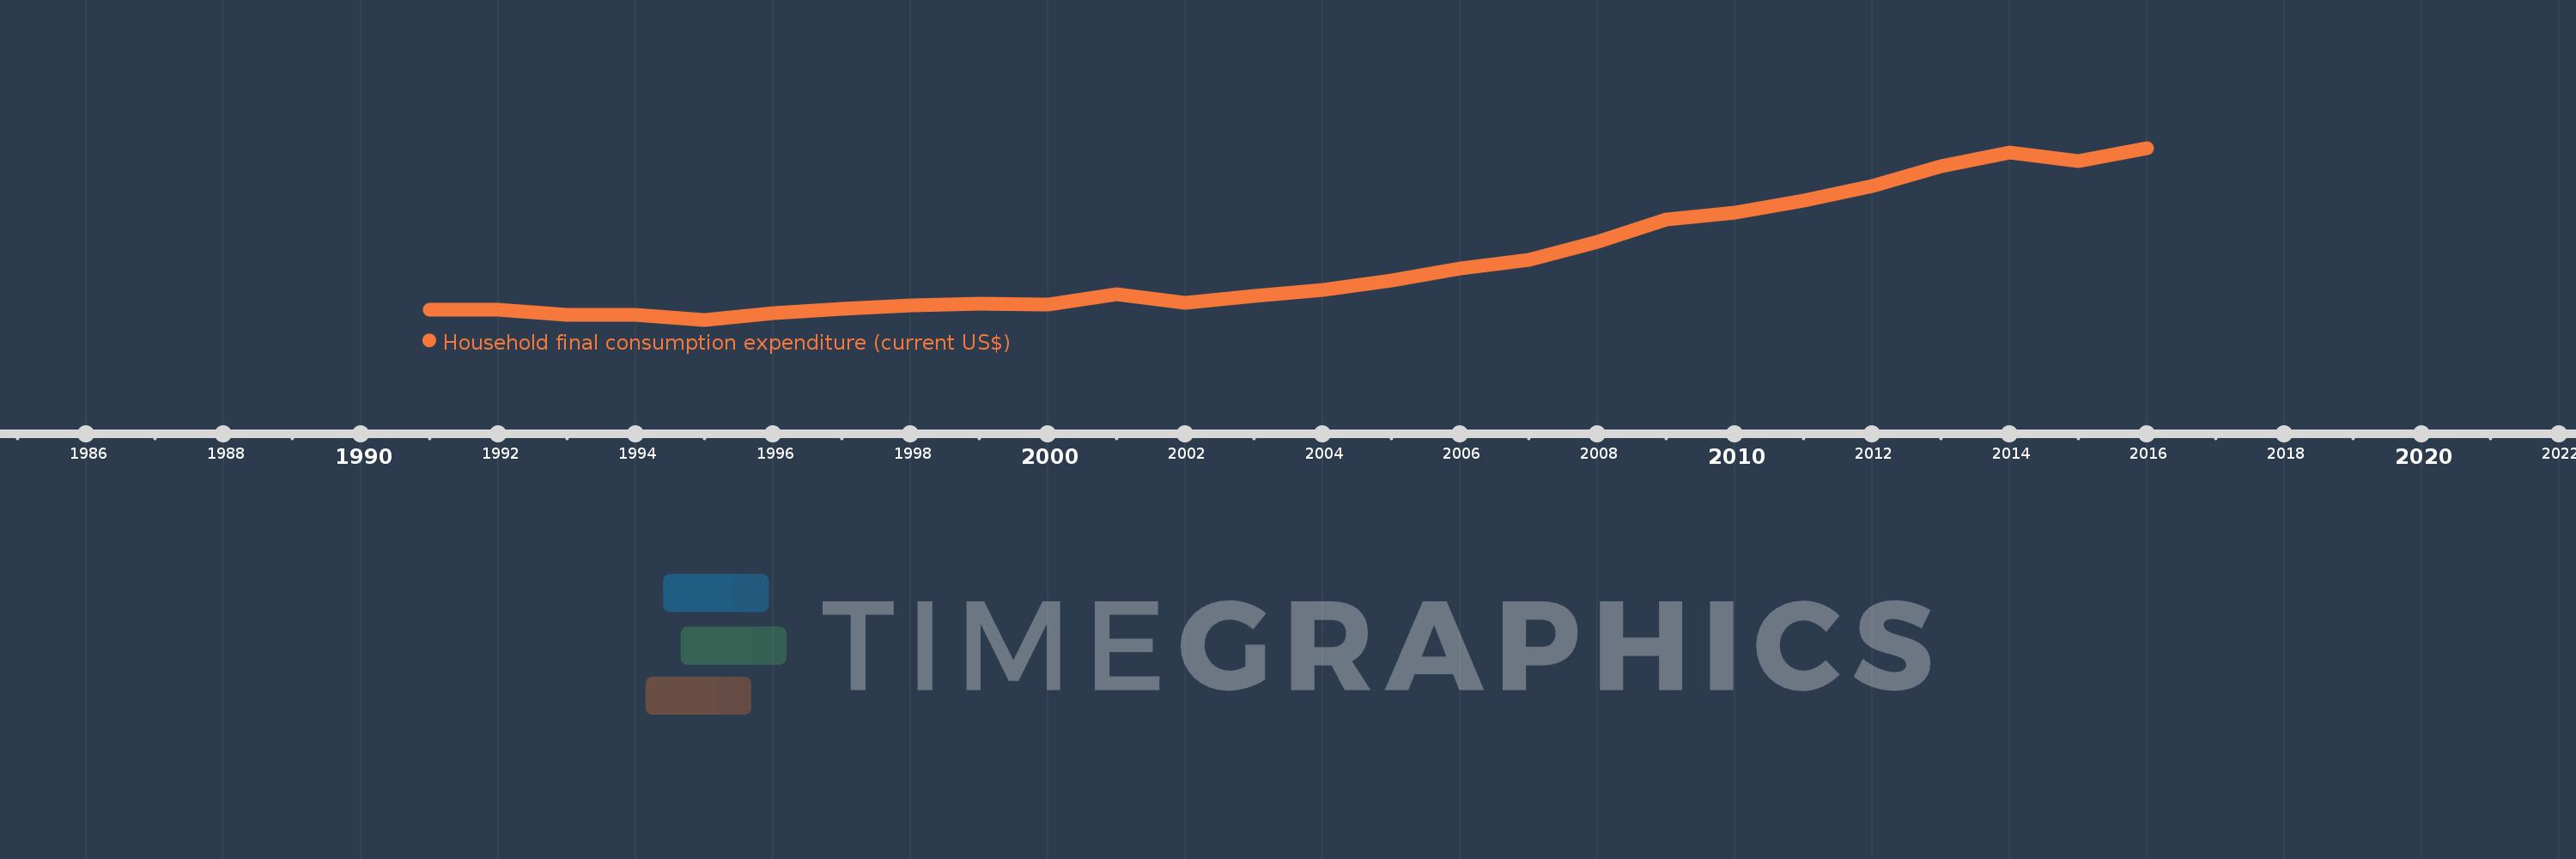
Household final consumption expenditure (current US$)
2016,2015,2014,2013,2012,2011,2010,2009,2008,2007,2006,2005,2004,2003,2002,2001,2000,1999,1998,1997,1996,1995,1994,1993,1992,1991
This statistics in other country:
AfghanistanAlbaniaAlgeriaAngolaAntigua and BarbudaArab WorldArgentinaArmeniaArubaAustraliaAustriaAzerbaijanBahamas, TheBahrainBangladeshBarbadosBelarusBelgiumBelizeBeninBermudaBhutanBoliviaBosnia and HerzegovinaBotswanaBrazilBrunei DarussalamBulgariaBurkina FasoBurundiCabo VerdeCambodiaCameroonCanadaCaribbean small statesCentral African RepublicCentral Europe and the BalticsChadChileChinaColombiaComorosCongo, Dem. Rep.Congo, Rep.Costa RicaCote d'IvoireCroatiaCubaCyprusCzech RepublicDenmarkDjiboutiDominicaDominican RepublicEarly-demographic dividendEast Asia & PacificEast Asia & Pacific (excluding high income)East Asia & Pacific (IDA & IBRD countries)EcuadorEgypt, Arab Rep.El SalvadorEquatorial GuineaEritreaEstoniaEthiopiaEuro areaEurope & Central AsiaEurope & Central Asia (excluding high income)Europe & Central Asia (IDA & IBRD countries)European UnionFaroe IslandsFijiFinlandFranceGabonGambia, TheGeorgiaGermanyGhanaGreeceGrenadaGuatemalaGuineaGuinea-BissauGuyanaHaitiHeavily indebted poor countries (HIPC)High incomeHondurasHong Kong SAR, ChinaHungaryIBRD onlyIcelandIDA & IBRD totalIDA blendIDA onlyIDA totalIndiaIndonesiaIran, Islamic Rep.IrelandIsraelItalyJamaicaJapanJordanKazakhstanKenyaKiribatiKorea, Rep.KosovoKuwaitKyrgyz RepublicLao PDRLate-demographic dividendLatin America & Caribbean Latin America & Caribbean (excluding high income)Latin America & the Caribbean (IDA & IBRD countries)LatviaLeast developed countries: UN classificationLebanonLesothoLiberiaLibyaLithuaniaLow & middle incomeLow incomeLower middle incomeLuxembourgMacao SAR, ChinaMacedonia, FYRMadagascarMalawiMalaysiaMaliMaltaMauritaniaMauritiusMexicoMicronesia, Fed. Sts.Middle East & North AfricaMiddle East & North Africa (excluding high income)Middle East & North Africa (IDA & IBRD countries)Middle incomeMoldovaMongoliaMontenegroMoroccoMozambiqueNamibiaNepalNetherlandsNew CaledoniaNew ZealandNicaraguaNigerNigeriaNorth AmericaNorwayOECD membersOmanOther small statesPakistanPanamaPapua New GuineaParaguayPeruPhilippinesPolandPortugalPost-demographic dividendPre-demographic dividendPuerto RicoQatarRomaniaRussian FederationRwandaSaudi ArabiaSenegalSerbiaSeychellesSierra LeoneSingaporeSlovak RepublicSloveniaSmall statesSolomon IslandsSomaliaSouth AfricaSouth AsiaSouth Asia (IDA & IBRD)South SudanSpainSri LankaSt. Kitts and NevisSt. LuciaSt. Vincent and the GrenadinesSub-Saharan Africa Sub-Saharan Africa (excluding high income)Sub-Saharan Africa (IDA & IBRD countries)SudanSurinameSwazilandSwedenSwitzerlandSyrian Arab RepublicTajikistanTanzaniaThailandTimor-LesteTogoTongaTrinidad and TobagoTunisiaTurkeyTurkmenistanUgandaUkraineUnited Arab EmiratesUnited KingdomUnited StatesUpper middle incomeUruguayUzbekistanVanuatuVenezuela, RBVietnamWest Bank and GazaWorldYemen, Rep.ZambiaZimbabwe Timeline:
This timeline shows a graph from 1991 to 2016 of Low income. No data until 1990. Number of actual observations by date: 26.
Source name:
World Development Indicators
Source organization:
World Bank national accounts data, and OECD National Accounts data files.
Categories, topics:
Economy & Growth
Last updated:
apr 23, 2017
Indicators value changes by year
Minimum:
60.887 bln
jan 1, 1995
Maximum:
296.004 bln
jan 1, 2016
At the date of observation
Value
Absolute change
Change from previous value
jan 1, 1991
74.281 bln
+74.281 bln
0.0%
jan 1, 1992
74.966 bln
+685.094 mln
0.92%
jan 1, 1993
68.127 bln
-6.839 bln
-9.12%
jan 1, 1994
67.4 bln
-727.672 mln
-1.07%
jan 1, 1995
60.887 bln
-6.512 bln
-9.66%
jan 1, 1996
70.286 bln
+9.399 bln
15.44%
jan 1, 1997
76.057 bln
+5.771 bln
8.21%
jan 1, 1998
80.966 bln
+4.909 bln
6.45%
jan 1, 1999
82.622 bln
+1.656 bln
2.05%
jan 1, 2000
81.196 bln
-1.426 bln
-1.73%
jan 1, 2001
95.681 bln
+14.484 bln
17.84%
jan 1, 2002
84.06 bln
-11.621 bln
-12.15%
jan 1, 2003
93.77 bln
+9.71 bln
11.55%
jan 1, 2004
101.244 bln
+7.474 bln
7.97%
jan 1, 2005
114.711 bln
+13.467 bln
13.3%
jan 1, 2006
130.749 bln
+16.038 bln
13.98%
jan 1, 2007
143.192 bln
+12.442 bln
9.52%
jan 1, 2008
166.982 bln
+23.79 bln
16.61%
jan 1, 2009
198.329 bln
+31.347 bln
18.77%
jan 1, 2010
206.909 bln
+8.58 bln
4.33%
jan 1, 2011
223.688 bln
+16.779 bln
8.11%
jan 1, 2012
243.642 bln
+19.954 bln
8.92%
jan 1, 2013
271.138 bln
+27.495 bln
11.29%
jan 1, 2014
290.037 bln
+18.899 bln
6.97%
jan 1, 2015
277.803 bln
-12.234 bln
-4.22%
jan 1, 2016
296.004 bln
+18.201 bln
6.55%
Ranking of countries by current statistics by years


Comments: