29
/
en
AIzaSyAYiBZKx7MnpbEhh9jyipgxe19OcubqV5w
April 1, 2024
55589
Pre-demographic dividend
PRE
false
2
1
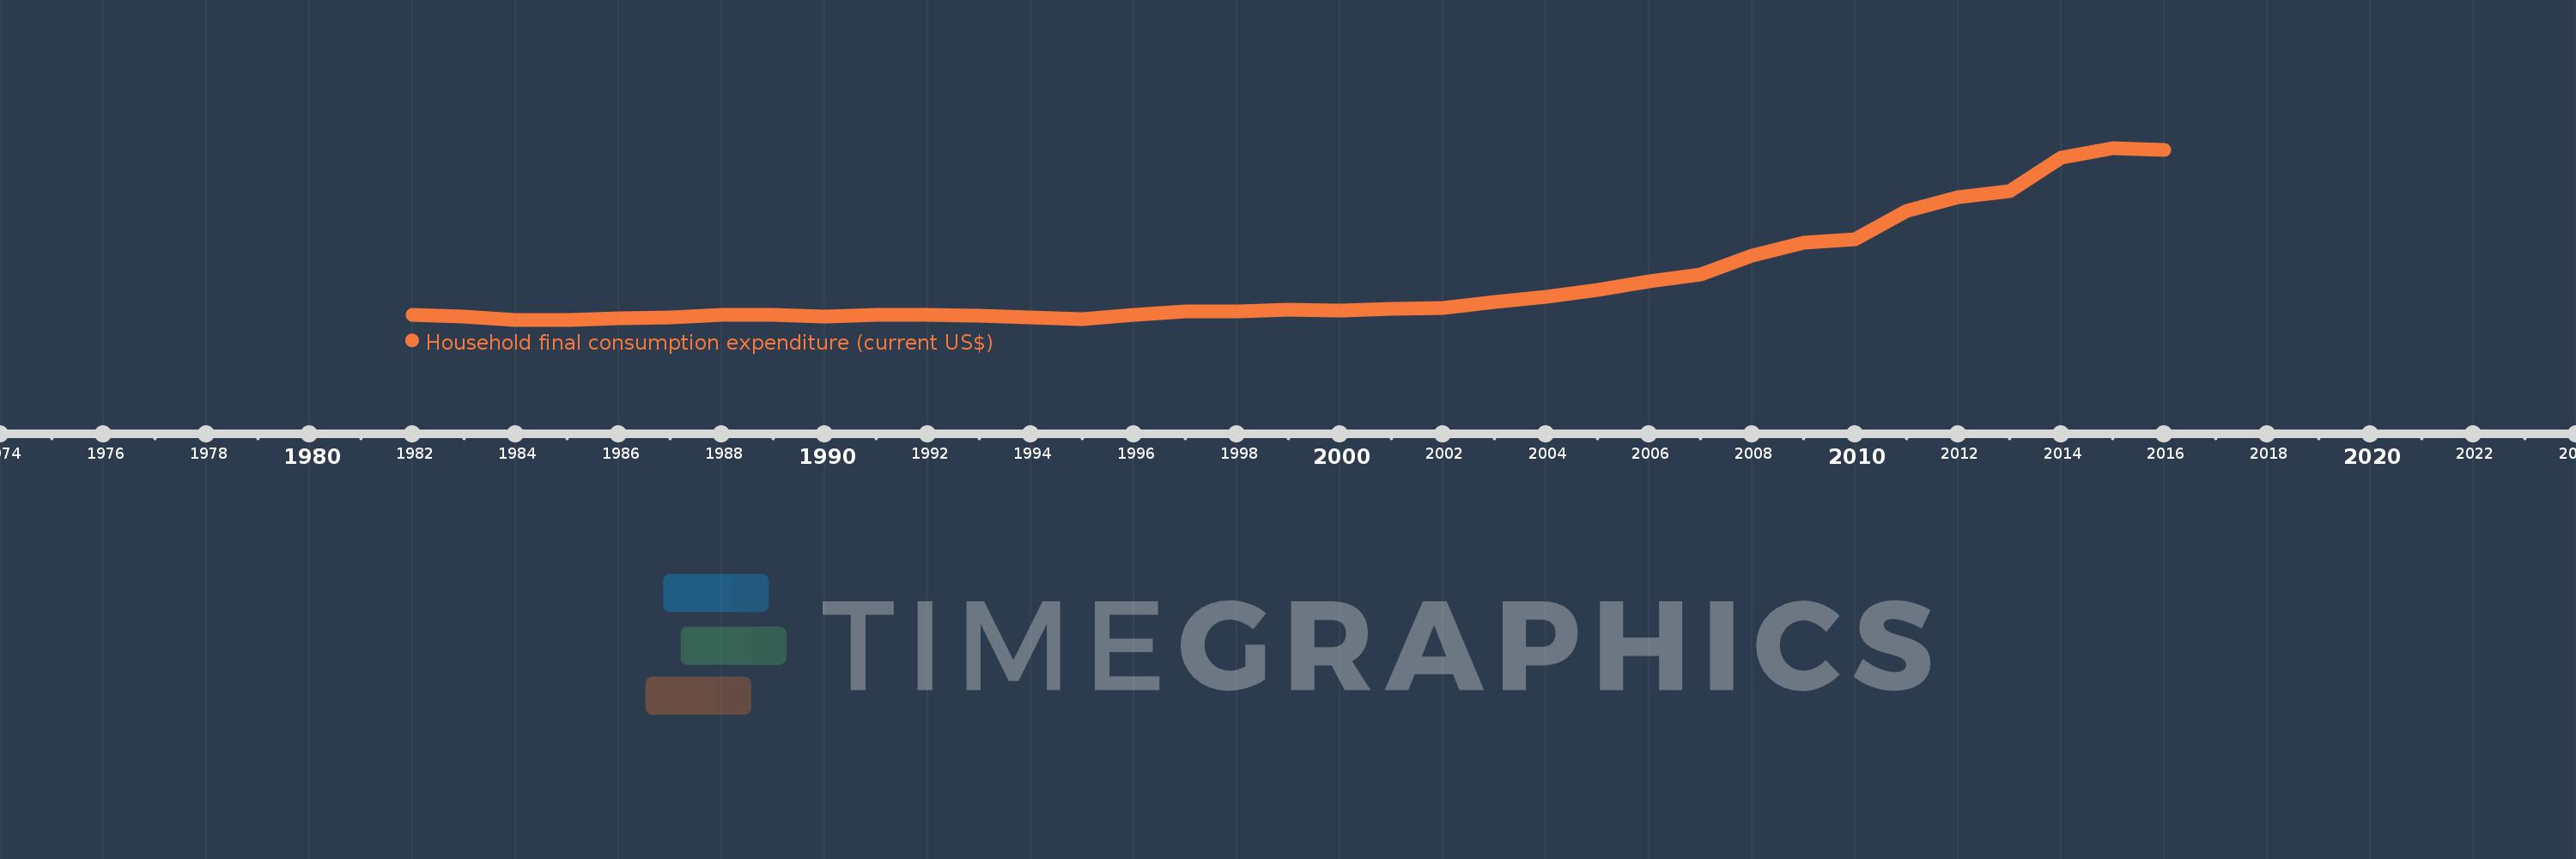
Household final consumption expenditure (current US$)
2016,2015,2014,2013,2012,2011,2010,2009,2008,2007,2006,2005,2004,2003,2002,2001,2000,1999,1998,1997,1996,1995,1994,1993,1992,1991,1990,1989,1988,1987,1986,1985,1984,1983,1982
This statistics in other country:
AfghanistanAlbaniaAlgeriaAngolaAntigua and BarbudaArab WorldArgentinaArmeniaArubaAustraliaAustriaAzerbaijanBahamas, TheBahrainBangladeshBarbadosBelarusBelgiumBelizeBeninBermudaBhutanBoliviaBosnia and HerzegovinaBotswanaBrazilBrunei DarussalamBulgariaBurkina FasoBurundiCabo VerdeCambodiaCameroonCanadaCaribbean small statesCentral African RepublicCentral Europe and the BalticsChadChileChinaColombiaComorosCongo, Dem. Rep.Congo, Rep.Costa RicaCote d'IvoireCroatiaCubaCyprusCzech RepublicDenmarkDjiboutiDominicaDominican RepublicEarly-demographic dividendEast Asia & PacificEast Asia & Pacific (excluding high income)East Asia & Pacific (IDA & IBRD countries)EcuadorEgypt, Arab Rep.El SalvadorEquatorial GuineaEritreaEstoniaEthiopiaEuro areaEurope & Central AsiaEurope & Central Asia (excluding high income)Europe & Central Asia (IDA & IBRD countries)European UnionFaroe IslandsFijiFinlandFranceGabonGambia, TheGeorgiaGermanyGhanaGreeceGrenadaGuatemalaGuineaGuinea-BissauGuyanaHaitiHeavily indebted poor countries (HIPC)High incomeHondurasHong Kong SAR, ChinaHungaryIBRD onlyIcelandIDA & IBRD totalIDA blendIDA onlyIDA totalIndiaIndonesiaIran, Islamic Rep.IrelandIsraelItalyJamaicaJapanJordanKazakhstanKenyaKiribatiKorea, Rep.KosovoKuwaitKyrgyz RepublicLao PDRLate-demographic dividendLatin America & Caribbean Latin America & Caribbean (excluding high income)Latin America & the Caribbean (IDA & IBRD countries)LatviaLeast developed countries: UN classificationLebanonLesothoLiberiaLibyaLithuaniaLow & middle incomeLow incomeLower middle incomeLuxembourgMacao SAR, ChinaMacedonia, FYRMadagascarMalawiMalaysiaMaliMaltaMauritaniaMauritiusMexicoMicronesia, Fed. Sts.Middle East & North AfricaMiddle East & North Africa (excluding high income)Middle East & North Africa (IDA & IBRD countries)Middle incomeMoldovaMongoliaMontenegroMoroccoMozambiqueNamibiaNepalNetherlandsNew CaledoniaNew ZealandNicaraguaNigerNigeriaNorth AmericaNorwayOECD membersOmanOther small statesPakistanPanamaPapua New GuineaParaguayPeruPhilippinesPolandPortugalPost-demographic dividendPre-demographic dividendPuerto RicoQatarRomaniaRussian FederationRwandaSaudi ArabiaSenegalSerbiaSeychellesSierra LeoneSingaporeSlovak RepublicSloveniaSmall statesSolomon IslandsSomaliaSouth AfricaSouth AsiaSouth Asia (IDA & IBRD)South SudanSpainSri LankaSt. Kitts and NevisSt. LuciaSt. Vincent and the GrenadinesSub-Saharan Africa Sub-Saharan Africa (excluding high income)Sub-Saharan Africa (IDA & IBRD countries)SudanSurinameSwazilandSwedenSwitzerlandSyrian Arab RepublicTajikistanTanzaniaThailandTimor-LesteTogoTongaTrinidad and TobagoTunisiaTurkeyTurkmenistanUgandaUkraineUnited Arab EmiratesUnited KingdomUnited StatesUpper middle incomeUruguayUzbekistanVanuatuVenezuela, RBVietnamWest Bank and GazaWorldYemen, Rep.ZambiaZimbabwe Timeline:
This timeline shows a graph from 1982 to 2016 of Pre-demographic dividend. No data until 1981. Number of actual observations by date: 35.
Source name:
World Development Indicators
Source organization:
World Bank national accounts data, and OECD National Accounts data files.
Categories, topics:
Economy & Growth
Last updated:
apr 23, 2017
Indicators value changes by year
Minimum:
94.68 bln
jan 1, 1985
Maximum:
1.015 trl
jan 1, 2015
At the date of observation
Value
Absolute change
Change from previous value
jan 1, 1982
122.674 bln
+122.674 bln
0.0%
jan 1, 1983
111.778 bln
-10.895 bln
-8.88%
jan 1, 1984
95.532 bln
-16.246 bln
-14.53%
jan 1, 1985
94.68 bln
-852.42 mln
-0.89%
jan 1, 1986
100.212 bln
+5.532 bln
5.84%
jan 1, 1987
106.11 bln
+5.898 bln
5.89%
jan 1, 1988
120.497 bln
+14.387 bln
13.56%
jan 1, 1989
119.837 bln
-660.196 mln
-0.55%
jan 1, 1990
112.961 bln
-6.876 bln
-5.74%
jan 1, 1991
122.881 bln
+9.921 bln
8.78%
jan 1, 1992
119.386 bln
-3.496 bln
-2.84%
jan 1, 1993
117.108 bln
-2.278 bln
-1.91%
jan 1, 1994
105.866 bln
-11.241 bln
-9.6%
jan 1, 1995
97.553 bln
-8.314 bln
-7.85%
jan 1, 1996
122.713 bln
+25.161 bln
25.79%
jan 1, 1997
137.883 bln
+15.17 bln
12.36%
jan 1, 1998
141.459 bln
+3.576 bln
2.59%
jan 1, 1999
147.834 bln
+6.375 bln
4.51%
jan 1, 2000
144.468 bln
-3.366 bln
-2.28%
jan 1, 2001
152.043 bln
+7.575 bln
5.24%
jan 1, 2002
157.909 bln
+5.866 bln
3.86%
jan 1, 2003
188.559 bln
+30.65 bln
19.41%
jan 1, 2004
217.252 bln
+28.693 bln
15.22%
jan 1, 2005
252.611 bln
+35.359 bln
16.28%
jan 1, 2006
301.33 bln
+48.719 bln
19.29%
jan 1, 2007
337.447 bln
+36.118 bln
11.99%
jan 1, 2008
440.352 bln
+102.905 bln
30.5%
jan 1, 2009
507.499 bln
+67.147 bln
15.25%
jan 1, 2010
527.08 bln
+19.581 bln
3.86%
jan 1, 2011
679.711 bln
+152.63 bln
28.96%
jan 1, 2012
751.775 bln
+72.065 bln
10.6%
jan 1, 2013
785.222 bln
+33.447 bln
4.45%
jan 1, 2014
963.769 bln
+178.547 bln
22.74%
jan 1, 2015
1.015 trl
+51.463 bln
5.34%
jan 1, 2016
1.003 trl
-12.029 bln
-1.18%
Ranking of countries by current statistics by years


Comments: