29
/
en
AIzaSyAYiBZKx7MnpbEhh9jyipgxe19OcubqV5w
April 1, 2024
225997
Portugal
PRT
true
2
1
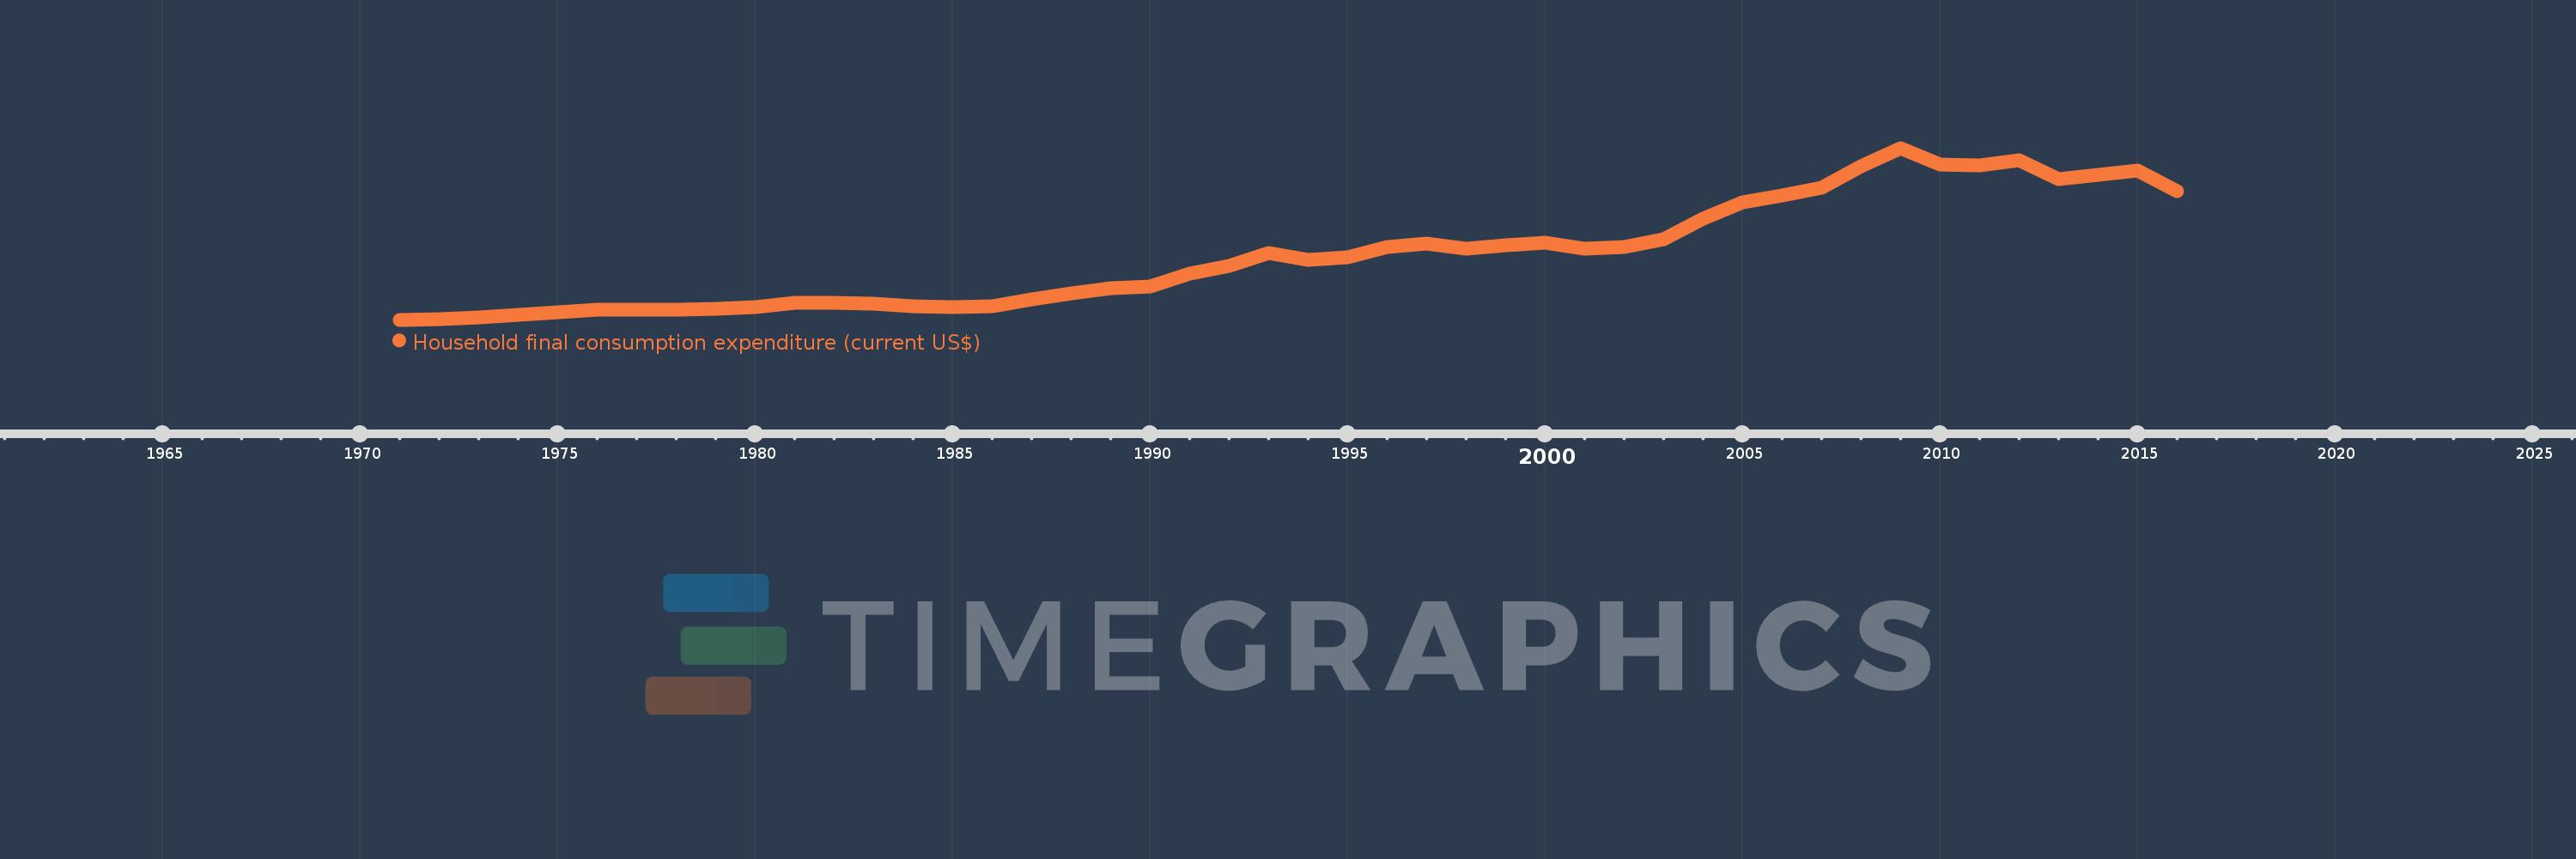
Household final consumption expenditure (current US$)
2016,2015,2014,2013,2012,2011,2010,2009,2008,2007,2006,2005,2004,2003,2002,2001,2000,1999,1998,1997,1996,1995,1994,1993,1992,1991,1990,1989,1988,1987,1986,1985,1984,1983,1982,1981,1980,1979,1978,1977,1976,1975,1974,1973,1972,1971
This statistics in other country:
AfghanistanAlbaniaAlgeriaAngolaAntigua and BarbudaArab WorldArgentinaArmeniaArubaAustraliaAustriaAzerbaijanBahamas, TheBahrainBangladeshBarbadosBelarusBelgiumBelizeBeninBermudaBhutanBoliviaBosnia and HerzegovinaBotswanaBrazilBrunei DarussalamBulgariaBurkina FasoBurundiCabo VerdeCambodiaCameroonCanadaCaribbean small statesCentral African RepublicCentral Europe and the BalticsChadChileChinaColombiaComorosCongo, Dem. Rep.Congo, Rep.Costa RicaCote d'IvoireCroatiaCubaCyprusCzech RepublicDenmarkDjiboutiDominicaDominican RepublicEarly-demographic dividendEast Asia & PacificEast Asia & Pacific (excluding high income)East Asia & Pacific (IDA & IBRD countries)EcuadorEgypt, Arab Rep.El SalvadorEquatorial GuineaEritreaEstoniaEthiopiaEuro areaEurope & Central AsiaEurope & Central Asia (excluding high income)Europe & Central Asia (IDA & IBRD countries)European UnionFaroe IslandsFijiFinlandFranceGabonGambia, TheGeorgiaGermanyGhanaGreeceGrenadaGuatemalaGuineaGuinea-BissauGuyanaHaitiHeavily indebted poor countries (HIPC)High incomeHondurasHong Kong SAR, ChinaHungaryIBRD onlyIcelandIDA & IBRD totalIDA blendIDA onlyIDA totalIndiaIndonesiaIran, Islamic Rep.IrelandIsraelItalyJamaicaJapanJordanKazakhstanKenyaKiribatiKorea, Rep.KosovoKuwaitKyrgyz RepublicLao PDRLate-demographic dividendLatin America & Caribbean Latin America & Caribbean (excluding high income)Latin America & the Caribbean (IDA & IBRD countries)LatviaLeast developed countries: UN classificationLebanonLesothoLiberiaLibyaLithuaniaLow & middle incomeLow incomeLower middle incomeLuxembourgMacao SAR, ChinaMacedonia, FYRMadagascarMalawiMalaysiaMaliMaltaMauritaniaMauritiusMexicoMicronesia, Fed. Sts.Middle East & North AfricaMiddle East & North Africa (excluding high income)Middle East & North Africa (IDA & IBRD countries)Middle incomeMoldovaMongoliaMontenegroMoroccoMozambiqueNamibiaNepalNetherlandsNew CaledoniaNew ZealandNicaraguaNigerNigeriaNorth AmericaNorwayOECD membersOmanOther small statesPakistanPanamaPapua New GuineaParaguayPeruPhilippinesPolandPortugalPost-demographic dividendPre-demographic dividendPuerto RicoQatarRomaniaRussian FederationRwandaSaudi ArabiaSenegalSerbiaSeychellesSierra LeoneSingaporeSlovak RepublicSloveniaSmall statesSolomon IslandsSomaliaSouth AfricaSouth AsiaSouth Asia (IDA & IBRD)South SudanSpainSri LankaSt. Kitts and NevisSt. LuciaSt. Vincent and the GrenadinesSub-Saharan Africa Sub-Saharan Africa (excluding high income)Sub-Saharan Africa (IDA & IBRD countries)SudanSurinameSwazilandSwedenSwitzerlandSyrian Arab RepublicTajikistanTanzaniaThailandTimor-LesteTogoTongaTrinidad and TobagoTunisiaTurkeyTurkmenistanUgandaUkraineUnited Arab EmiratesUnited KingdomUnited StatesUpper middle incomeUruguayUzbekistanVanuatuVenezuela, RBVietnamWest Bank and GazaWorldYemen, Rep.ZambiaZimbabwe Timeline:
This timeline shows a graph from 1971 to 2016 of Portugal. No data until 1970. Number of actual observations by date: 46.
Source name:
World Development Indicators
Source organization:
World Bank national accounts data, and OECD National Accounts data files.
Categories, topics:
Economy & Growth
Last updated:
apr 23, 2017
Indicators value changes by year
Minimum:
5.324 bln
jan 1, 1971
Maximum:
173.561 bln
jan 1, 2009
At the date of observation
Value
Absolute change
Change from previous value
jan 1, 1971
5.324 bln
+5.324 bln
0.0%
jan 1, 1972
6.256 bln
+932.285 mln
17.51%
jan 1, 1973
7.182 bln
+925.963 mln
14.8%
jan 1, 1974
9.747 bln
+2.565 bln
35.71%
jan 1, 1975
12.675 bln
+2.928 bln
30.04%
jan 1, 1976
14.864 bln
+2.189 bln
17.27%
jan 1, 1977
15.19 bln
+326.78 mln
2.2%
jan 1, 1978
15.367 bln
+176.654 mln
1.16%
jan 1, 1979
15.912 bln
+544.844 mln
3.55%
jan 1, 1980
17.911 bln
+1.999 bln
12.56%
jan 1, 1981
22.155 bln
+4.244 bln
23.7%
jan 1, 1982
22.242 bln
+86.702 mln
0.39%
jan 1, 1983
21.189 bln
-1.053 bln
-4.74%
jan 1, 1984
18.883 bln
-2.305 bln
-10.88%
jan 1, 1985
17.799 bln
-1.084 bln
-5.74%
jan 1, 1986
18.386 bln
+586.856 mln
3.3%
jan 1, 1987
25.173 bln
+6.787 bln
36.92%
jan 1, 1988
30.933 bln
+5.76 bln
22.88%
jan 1, 1989
36.069 bln
+5.136 bln
16.6%
jan 1, 1990
38.284 bln
+2.215 bln
6.14%
jan 1, 1991
50.221 bln
+11.937 bln
31.18%
jan 1, 1992
57.745 bln
+7.524 bln
14.98%
jan 1, 1993
70.676 bln
+12.931 bln
22.39%
jan 1, 1994
64.113 bln
-6.563 bln
-9.29%
jan 1, 1995
66.267 bln
+2.154 bln
3.36%
jan 1, 1996
76.351 bln
+10.084 bln
15.22%
jan 1, 1997
79.644 bln
+3.293 bln
4.31%
jan 1, 1998
74.612 bln
-5.033 bln
-6.32%
jan 1, 1999
77.978 bln
+3.366 bln
4.51%
jan 1, 2000
80.517 bln
+2.539 bln
3.26%
jan 1, 2001
74.868 bln
-5.649 bln
-7.02%
jan 1, 2002
76.189 bln
+1.321 bln
1.76%
jan 1, 2003
84.009 bln
+7.82 bln
10.26%
jan 1, 2004
104.106 bln
+20.097 bln
23.92%
jan 1, 2005
120.192 bln
+16.086 bln
15.45%
jan 1, 2006
126.981 bln
+6.789 bln
5.65%
jan 1, 2007
134.617 bln
+7.636 bln
6.01%
jan 1, 2008
155.643 bln
+21.026 bln
15.62%
jan 1, 2009
173.561 bln
+17.918 bln
11.51%
jan 1, 2010
157.695 bln
-15.866 bln
-9.14%
jan 1, 2011
156.727 bln
-968.007 mln
-0.61%
jan 1, 2012
161.191 bln
+4.464 bln
2.85%
jan 1, 2013
143.404 bln
-17.788 bln
-11.04%
jan 1, 2014
147.57 bln
+4.166 bln
2.91%
jan 1, 2015
151.726 bln
+4.156 bln
2.82%
jan 1, 2016
131.033 bln
-20.693 bln
-13.64%
Ranking of countries by current statistics by years


Comments: