29
/
en
AIzaSyAYiBZKx7MnpbEhh9jyipgxe19OcubqV5w
April 1, 2024
39978
IDA total
IDA
false
2
1
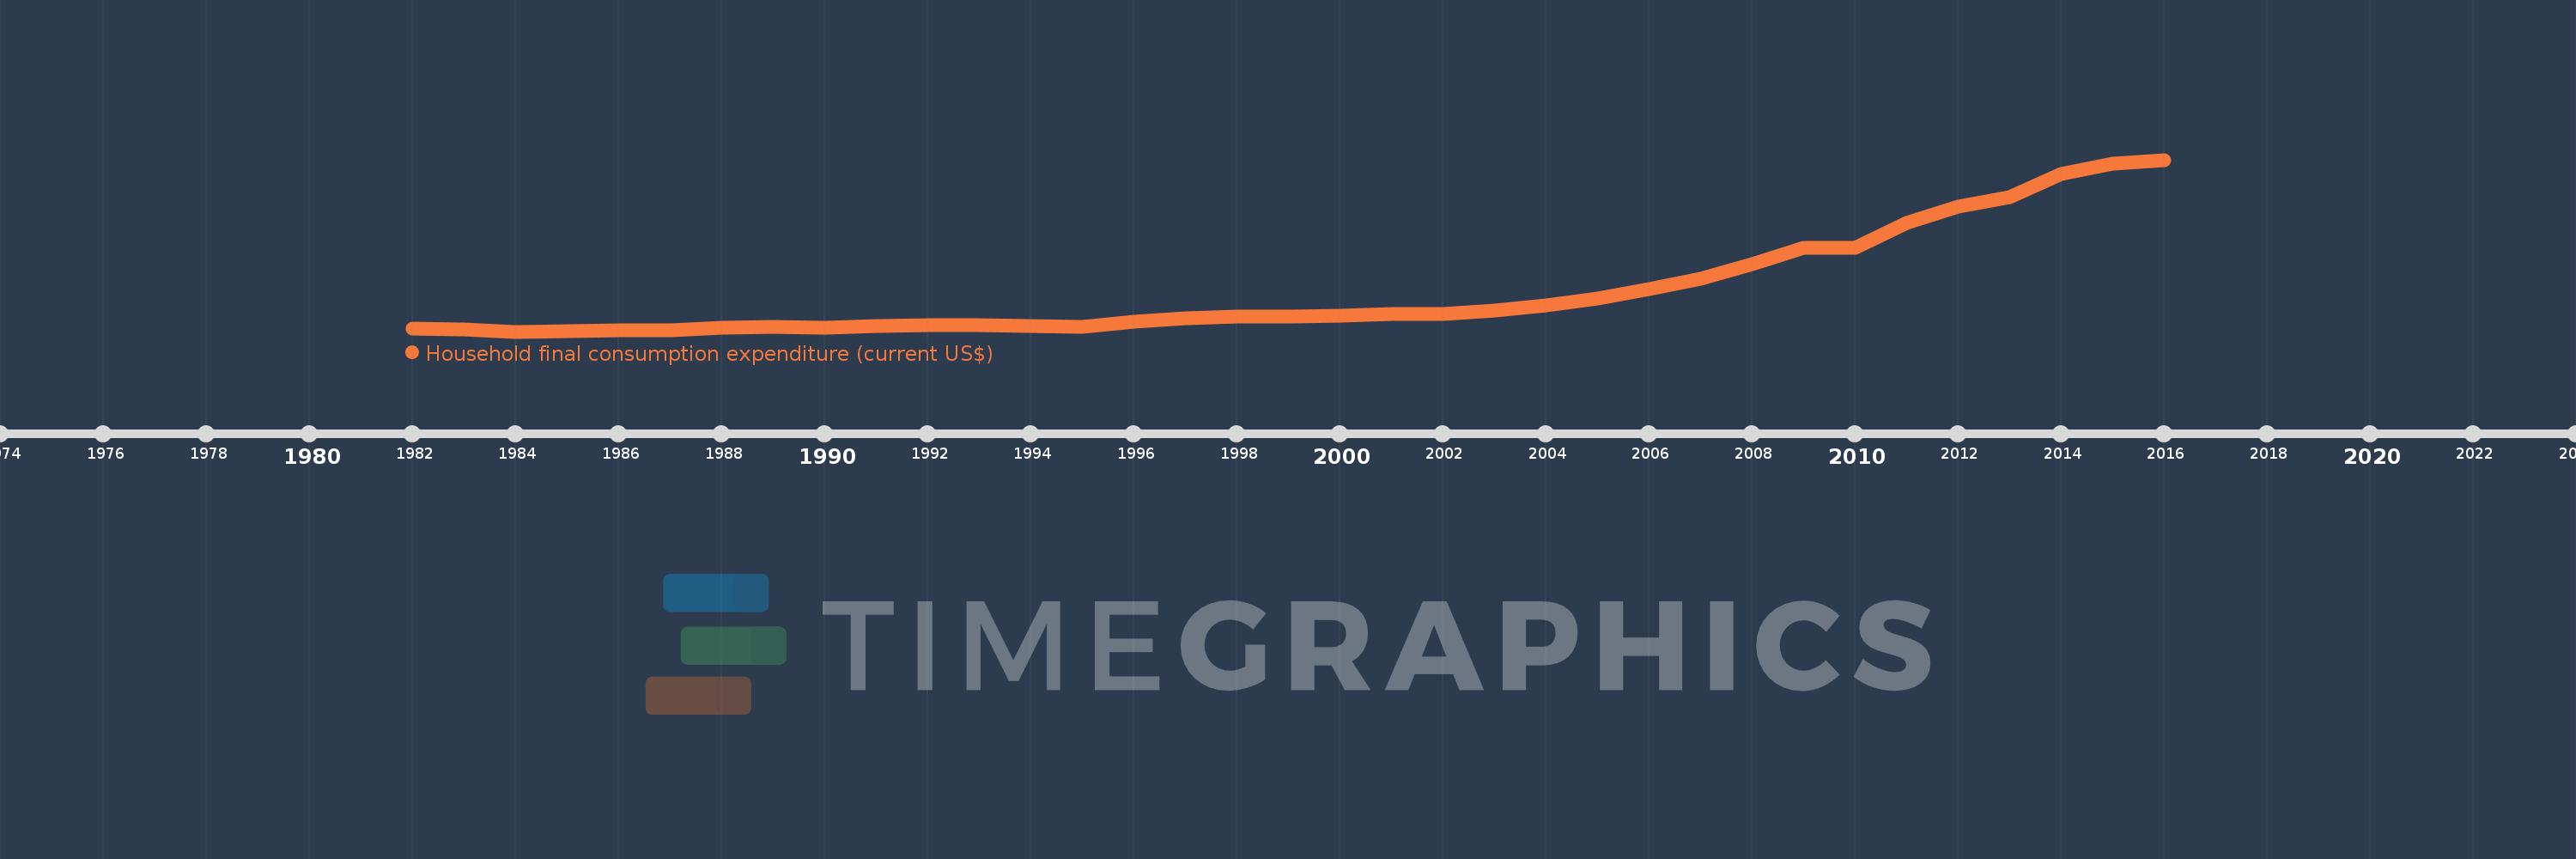
Household final consumption expenditure (current US$)
2016,2015,2014,2013,2012,2011,2010,2009,2008,2007,2006,2005,2004,2003,2002,2001,2000,1999,1998,1997,1996,1995,1994,1993,1992,1991,1990,1989,1988,1987,1986,1985,1984,1983,1982
This statistics in other country:
AfghanistanAlbaniaAlgeriaAngolaAntigua and BarbudaArab WorldArgentinaArmeniaArubaAustraliaAustriaAzerbaijanBahamas, TheBahrainBangladeshBarbadosBelarusBelgiumBelizeBeninBermudaBhutanBoliviaBosnia and HerzegovinaBotswanaBrazilBrunei DarussalamBulgariaBurkina FasoBurundiCabo VerdeCambodiaCameroonCanadaCaribbean small statesCentral African RepublicCentral Europe and the BalticsChadChileChinaColombiaComorosCongo, Dem. Rep.Congo, Rep.Costa RicaCote d'IvoireCroatiaCubaCyprusCzech RepublicDenmarkDjiboutiDominicaDominican RepublicEarly-demographic dividendEast Asia & PacificEast Asia & Pacific (excluding high income)East Asia & Pacific (IDA & IBRD countries)EcuadorEgypt, Arab Rep.El SalvadorEquatorial GuineaEritreaEstoniaEthiopiaEuro areaEurope & Central AsiaEurope & Central Asia (excluding high income)Europe & Central Asia (IDA & IBRD countries)European UnionFaroe IslandsFijiFinlandFranceGabonGambia, TheGeorgiaGermanyGhanaGreeceGrenadaGuatemalaGuineaGuinea-BissauGuyanaHaitiHeavily indebted poor countries (HIPC)High incomeHondurasHong Kong SAR, ChinaHungaryIBRD onlyIcelandIDA & IBRD totalIDA blendIDA onlyIDA totalIndiaIndonesiaIran, Islamic Rep.IrelandIsraelItalyJamaicaJapanJordanKazakhstanKenyaKiribatiKorea, Rep.KosovoKuwaitKyrgyz RepublicLao PDRLate-demographic dividendLatin America & Caribbean Latin America & Caribbean (excluding high income)Latin America & the Caribbean (IDA & IBRD countries)LatviaLeast developed countries: UN classificationLebanonLesothoLiberiaLibyaLithuaniaLow & middle incomeLow incomeLower middle incomeLuxembourgMacao SAR, ChinaMacedonia, FYRMadagascarMalawiMalaysiaMaliMaltaMauritaniaMauritiusMexicoMicronesia, Fed. Sts.Middle East & North AfricaMiddle East & North Africa (excluding high income)Middle East & North Africa (IDA & IBRD countries)Middle incomeMoldovaMongoliaMontenegroMoroccoMozambiqueNamibiaNepalNetherlandsNew CaledoniaNew ZealandNicaraguaNigerNigeriaNorth AmericaNorwayOECD membersOmanOther small statesPakistanPanamaPapua New GuineaParaguayPeruPhilippinesPolandPortugalPost-demographic dividendPre-demographic dividendPuerto RicoQatarRomaniaRussian FederationRwandaSaudi ArabiaSenegalSerbiaSeychellesSierra LeoneSingaporeSlovak RepublicSloveniaSmall statesSolomon IslandsSomaliaSouth AfricaSouth AsiaSouth Asia (IDA & IBRD)South SudanSpainSri LankaSt. Kitts and NevisSt. LuciaSt. Vincent and the GrenadinesSub-Saharan Africa Sub-Saharan Africa (excluding high income)Sub-Saharan Africa (IDA & IBRD countries)SudanSurinameSwazilandSwedenSwitzerlandSyrian Arab RepublicTajikistanTanzaniaThailandTimor-LesteTogoTongaTrinidad and TobagoTunisiaTurkeyTurkmenistanUgandaUkraineUnited Arab EmiratesUnited KingdomUnited StatesUpper middle incomeUruguayUzbekistanVanuatuVenezuela, RBVietnamWest Bank and GazaWorldYemen, Rep.ZambiaZimbabwe Timeline:
This timeline shows a graph from 1982 to 2016 of IDA total. No data until 1981. Number of actual observations by date: 35.
Source name:
World Development Indicators
Source organization:
World Bank national accounts data, and OECD National Accounts data files.
Categories, topics:
Economy & Growth
Last updated:
apr 23, 2017
Indicators value changes by year
Minimum:
197.235 bln
jan 1, 1984
Maximum:
1.746 trl
jan 1, 2016
At the date of observation
Value
Absolute change
Change from previous value
jan 1, 1982
222.097 bln
+222.097 bln
0.0%
jan 1, 1983
212.736 bln
-9.361 bln
-4.21%
jan 1, 1984
197.235 bln
-15.502 bln
-7.29%
jan 1, 1985
200.269 bln
+3.034 bln
1.54%
jan 1, 1986
206.676 bln
+6.407 bln
3.2%
jan 1, 1987
210.613 bln
+3.937 bln
1.9%
jan 1, 1988
228.405 bln
+17.792 bln
8.45%
jan 1, 1989
236.567 bln
+8.162 bln
3.57%
jan 1, 1990
232.049 bln
-4.518 bln
-1.91%
jan 1, 1991
247.645 bln
+15.595 bln
6.72%
jan 1, 1992
253.316 bln
+5.671 bln
2.29%
jan 1, 1993
254.688 bln
+1.372 bln
0.54%
jan 1, 1994
248.027 bln
-6.66 bln
-2.62%
jan 1, 1995
241.446 bln
-6.581 bln
-2.65%
jan 1, 1996
283.57 bln
+42.124 bln
17.45%
jan 1, 1997
316.866 bln
+33.296 bln
11.74%
jan 1, 1998
329.833 bln
+12.968 bln
4.09%
jan 1, 1999
333.751 bln
+3.917 bln
1.19%
jan 1, 2000
338.68 bln
+4.929 bln
1.48%
jan 1, 2001
356.53 bln
+17.85 bln
5.27%
jan 1, 2002
359.847 bln
+3.318 bln
0.93%
jan 1, 2003
389.093 bln
+29.245 bln
8.13%
jan 1, 2004
435.744 bln
+46.652 bln
11.99%
jan 1, 2005
496.5 bln
+60.755 bln
13.94%
jan 1, 2006
583.374 bln
+86.874 bln
17.5%
jan 1, 2007
676.105 bln
+92.731 bln
15.9%
jan 1, 2008
807.481 bln
+131.376 bln
19.43%
jan 1, 2009
952.301 bln
+144.819 bln
17.93%
jan 1, 2010
954.281 bln
+1.981 bln
0.21%
jan 1, 2011
1.174 trl
+220.013 bln
23.06%
jan 1, 2012
1.324 trl
+150.196 bln
12.79%
jan 1, 2013
1.408 trl
+83.381 bln
6.3%
jan 1, 2014
1.617 trl
+209.628 bln
14.89%
jan 1, 2015
1.708 trl
+90.705 bln
5.61%
jan 1, 2016
1.746 trl
+38.071 bln
2.23%
Ranking of countries by current statistics by years


Comments: