29
/
en
AIzaSyAYiBZKx7MnpbEhh9jyipgxe19OcubqV5w
April 1, 2024
35033
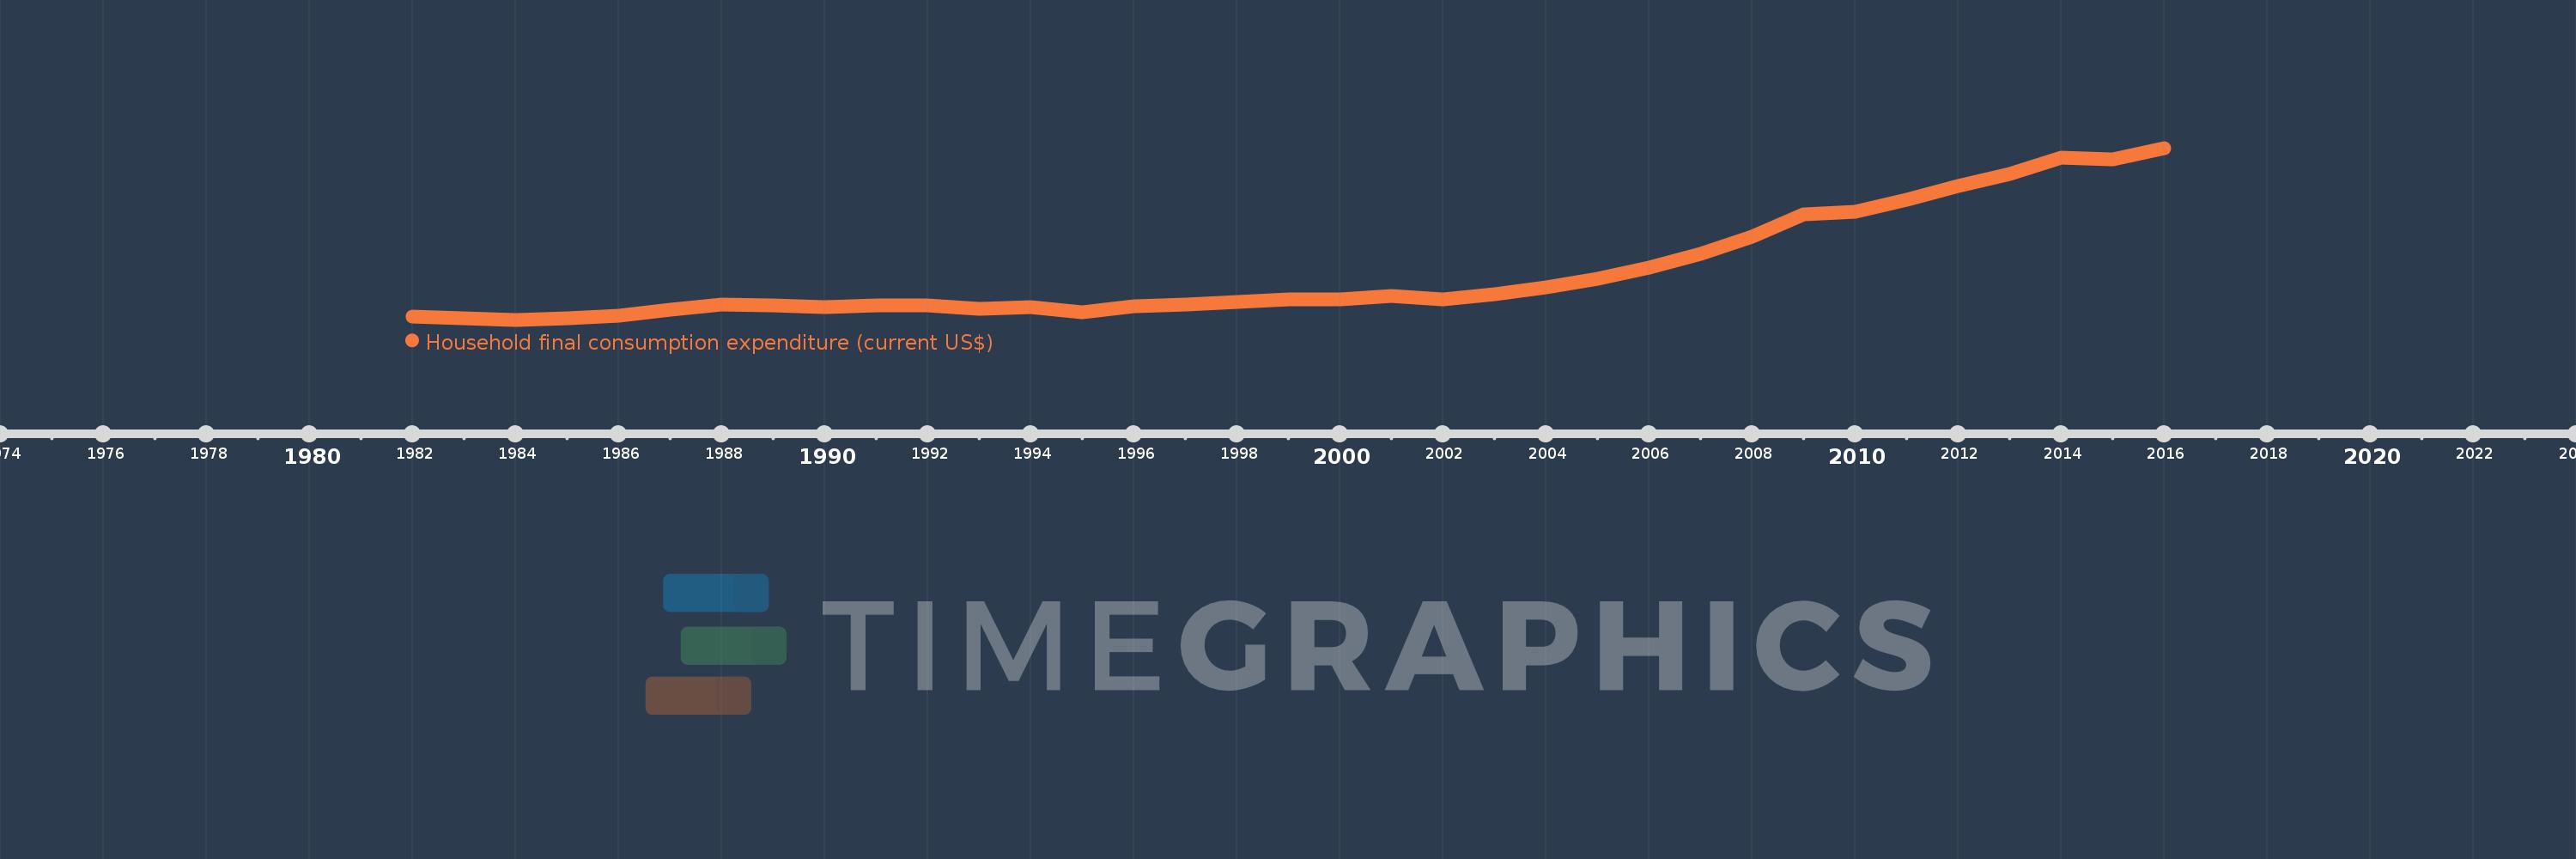
Heavily indebted poor countries (HIPC)
HPC
false
2
1
Household final consumption expenditure (current US$)
2016,2015,2014,2013,2012,2011,2010,2009,2008,2007,2006,2005,2004,2003,2002,2001,2000,1999,1998,1997,1996,1995,1994,1993,1992,1991,1990,1989,1988,1987,1986,1985,1984,1983,1982
This statistics in other country:
AfghanistanAlbaniaAlgeriaAngolaAntigua and BarbudaArab WorldArgentinaArmeniaArubaAustraliaAustriaAzerbaijanBahamas, TheBahrainBangladeshBarbadosBelarusBelgiumBelizeBeninBermudaBhutanBoliviaBosnia and HerzegovinaBotswanaBrazilBrunei DarussalamBulgariaBurkina FasoBurundiCabo VerdeCambodiaCameroonCanadaCaribbean small statesCentral African RepublicCentral Europe and the BalticsChadChileChinaColombiaComorosCongo, Dem. Rep.Congo, Rep.Costa RicaCote d'IvoireCroatiaCubaCyprusCzech RepublicDenmarkDjiboutiDominicaDominican RepublicEarly-demographic dividendEast Asia & PacificEast Asia & Pacific (excluding high income)East Asia & Pacific (IDA & IBRD countries)EcuadorEgypt, Arab Rep.El SalvadorEquatorial GuineaEritreaEstoniaEthiopiaEuro areaEurope & Central AsiaEurope & Central Asia (excluding high income)Europe & Central Asia (IDA & IBRD countries)European UnionFaroe IslandsFijiFinlandFranceGabonGambia, TheGeorgiaGermanyGhanaGreeceGrenadaGuatemalaGuineaGuinea-BissauGuyanaHaitiHeavily indebted poor countries (HIPC)High incomeHondurasHong Kong SAR, ChinaHungaryIBRD onlyIcelandIDA & IBRD totalIDA blendIDA onlyIDA totalIndiaIndonesiaIran, Islamic Rep.IrelandIsraelItalyJamaicaJapanJordanKazakhstanKenyaKiribatiKorea, Rep.KosovoKuwaitKyrgyz RepublicLao PDRLate-demographic dividendLatin America & Caribbean Latin America & Caribbean (excluding high income)Latin America & the Caribbean (IDA & IBRD countries)LatviaLeast developed countries: UN classificationLebanonLesothoLiberiaLibyaLithuaniaLow & middle incomeLow incomeLower middle incomeLuxembourgMacao SAR, ChinaMacedonia, FYRMadagascarMalawiMalaysiaMaliMaltaMauritaniaMauritiusMexicoMicronesia, Fed. Sts.Middle East & North AfricaMiddle East & North Africa (excluding high income)Middle East & North Africa (IDA & IBRD countries)Middle incomeMoldovaMongoliaMontenegroMoroccoMozambiqueNamibiaNepalNetherlandsNew CaledoniaNew ZealandNicaraguaNigerNigeriaNorth AmericaNorwayOECD membersOmanOther small statesPakistanPanamaPapua New GuineaParaguayPeruPhilippinesPolandPortugalPost-demographic dividendPre-demographic dividendPuerto RicoQatarRomaniaRussian FederationRwandaSaudi ArabiaSenegalSerbiaSeychellesSierra LeoneSingaporeSlovak RepublicSloveniaSmall statesSolomon IslandsSomaliaSouth AfricaSouth AsiaSouth Asia (IDA & IBRD)South SudanSpainSri LankaSt. Kitts and NevisSt. LuciaSt. Vincent and the GrenadinesSub-Saharan Africa Sub-Saharan Africa (excluding high income)Sub-Saharan Africa (IDA & IBRD countries)SudanSurinameSwazilandSwedenSwitzerlandSyrian Arab RepublicTajikistanTanzaniaThailandTimor-LesteTogoTongaTrinidad and TobagoTunisiaTurkeyTurkmenistanUgandaUkraineUnited Arab EmiratesUnited KingdomUnited StatesUpper middle incomeUruguayUzbekistanVanuatuVenezuela, RBVietnamWest Bank and GazaWorldYemen, Rep.ZambiaZimbabwe Timeline:
This timeline shows a graph from 1982 to 2016 of Heavily indebted poor countries (HIPC). No data until 1981. Number of actual observations by date: 35.
Source name:
World Development Indicators
Source organization:
World Bank national accounts data, and OECD National Accounts data files.
Categories, topics:
Economy & Growth
Last updated:
apr 23, 2017
Indicators value changes by year
Minimum:
73.341 bln
jan 1, 1984
Maximum:
453.171 bln
jan 1, 2016
At the date of observation
Value
Absolute change
Change from previous value
jan 1, 1982
80.632 bln
+80.632 bln
0.0%
jan 1, 1983
77.096 bln
-3.537 bln
-4.39%
jan 1, 1984
73.341 bln
-3.754 bln
-4.87%
jan 1, 1985
76.714 bln
+3.373 bln
4.6%
jan 1, 1986
81.961 bln
+5.247 bln
6.84%
jan 1, 1987
94.928 bln
+12.967 bln
15.82%
jan 1, 1988
106.014 bln
+11.087 bln
11.68%
jan 1, 1989
104.773 bln
-1.242 bln
-1.17%
jan 1, 1990
101.739 bln
-3.034 bln
-2.9%
jan 1, 1991
104.262 bln
+2.522 bln
2.48%
jan 1, 1992
104.507 bln
+245.356 mln
0.24%
jan 1, 1993
98.136 bln
-6.371 bln
-6.1%
jan 1, 1994
100.562 bln
+2.426 bln
2.47%
jan 1, 1995
89.703 bln
-10.858 bln
-10.8%
jan 1, 1996
103.768 bln
+14.065 bln
15.68%
jan 1, 1997
106.929 bln
+3.161 bln
3.05%
jan 1, 1998
112.764 bln
+5.836 bln
5.46%
jan 1, 1999
118.14 bln
+5.375 bln
4.77%
jan 1, 2000
117.803 bln
-336.572 mln
-0.28%
jan 1, 2001
126.517 bln
+8.714 bln
7.4%
jan 1, 2002
117.69 bln
-8.827 bln
-6.98%
jan 1, 2003
129.417 bln
+11.727 bln
9.96%
jan 1, 2004
144.27 bln
+14.854 bln
11.48%
jan 1, 2005
163.088 bln
+18.818 bln
13.04%
jan 1, 2006
187.73 bln
+24.642 bln
15.11%
jan 1, 2007
218.54 bln
+30.81 bln
16.41%
jan 1, 2008
257.623 bln
+39.082 bln
17.88%
jan 1, 2009
307.116 bln
+49.493 bln
19.21%
jan 1, 2010
311.403 bln
+4.287 bln
1.4%
jan 1, 2011
339.569 bln
+28.166 bln
9.04%
jan 1, 2012
368.587 bln
+29.018 bln
8.55%
jan 1, 2013
395.482 bln
+26.894 bln
7.3%
jan 1, 2014
431.137 bln
+35.655 bln
9.02%
jan 1, 2015
427.996 bln
-3.141 bln
-0.73%
jan 1, 2016
453.171 bln
+25.175 bln
5.88%
Ranking of countries by current statistics by years


Comments: