29
/
en
AIzaSyAYiBZKx7MnpbEhh9jyipgxe19OcubqV5w
April 1, 2024
39054
IDA only
IDX
false
2
1
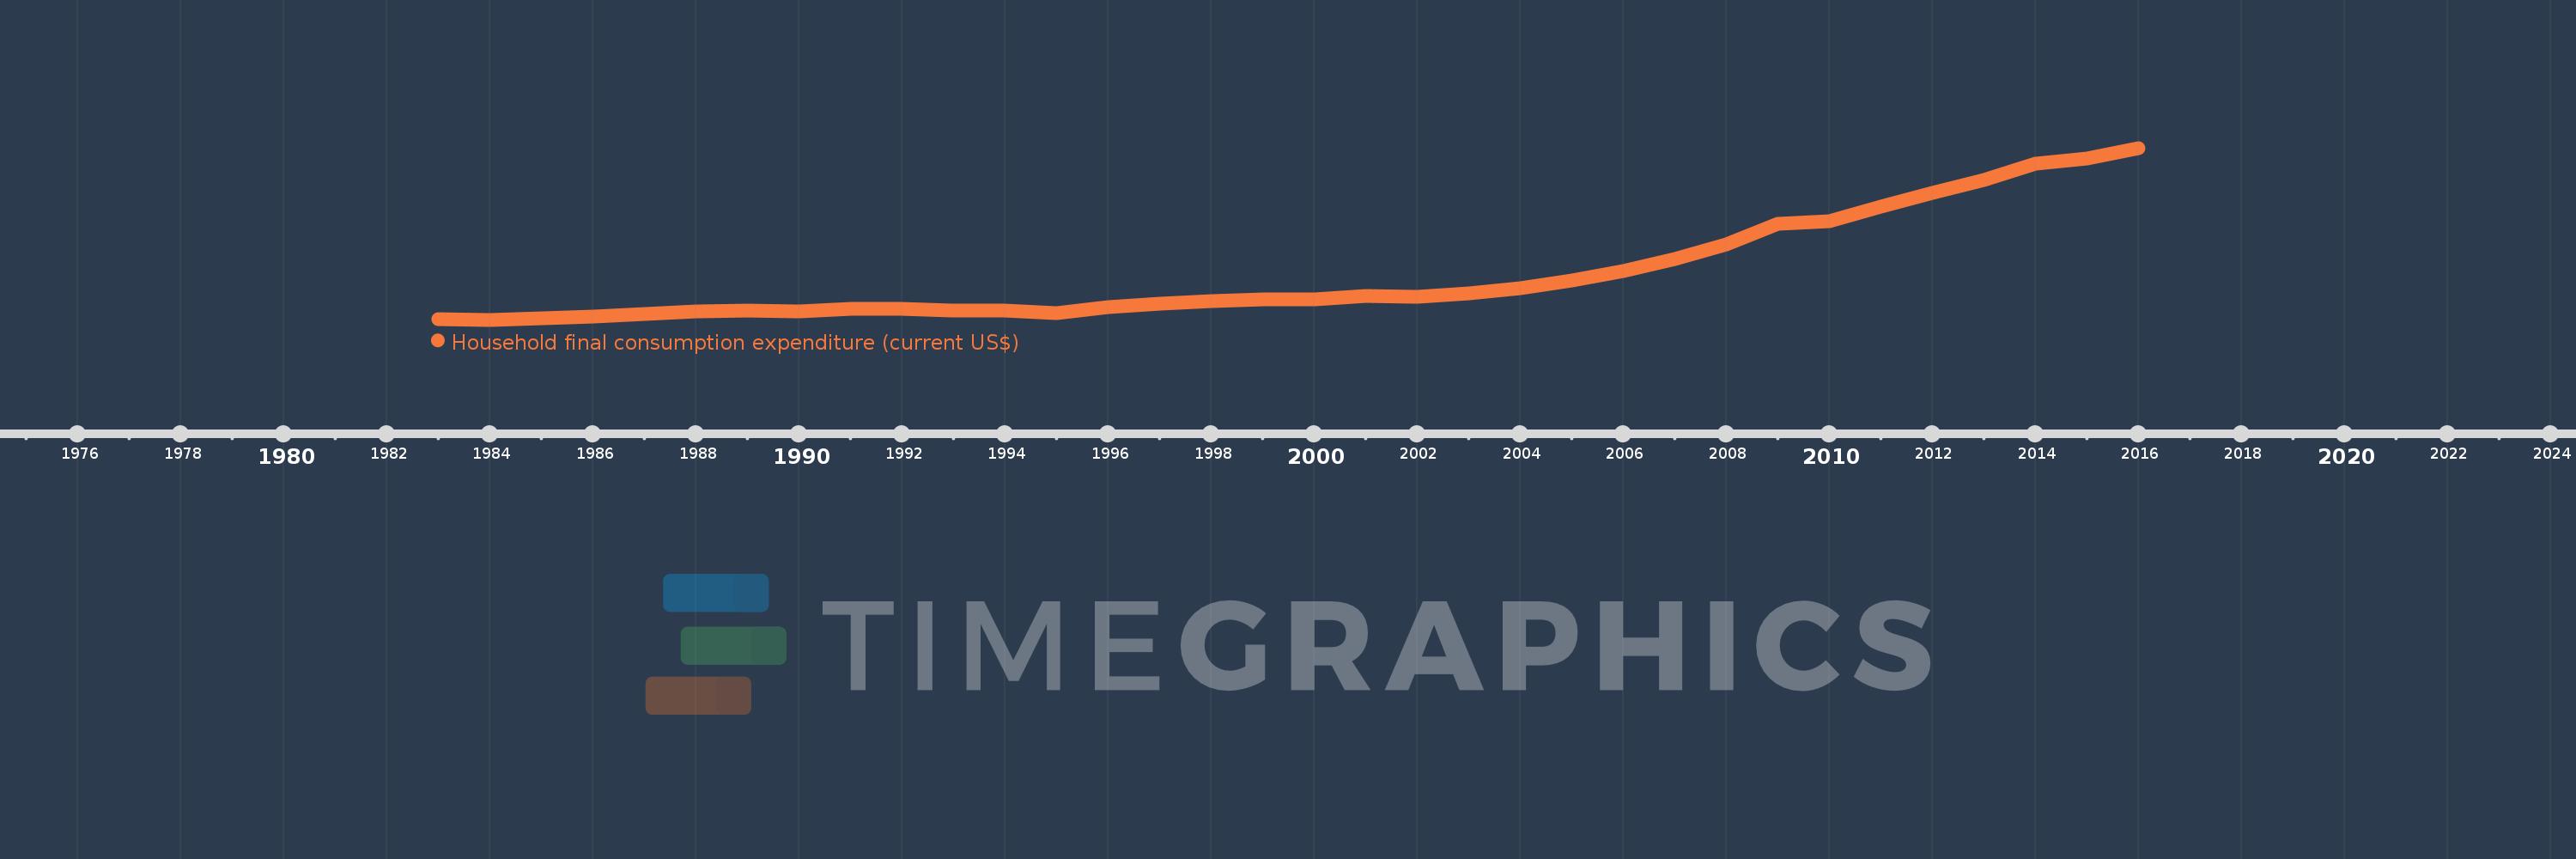
Household final consumption expenditure (current US$)
2016,2015,2014,2013,2012,2011,2010,2009,2008,2007,2006,2005,2004,2003,2002,2001,2000,1999,1998,1997,1996,1995,1994,1993,1992,1991,1990,1989,1988,1987,1986,1985,1984,1983
This statistics in other country:
AfghanistanAlbaniaAlgeriaAngolaAntigua and BarbudaArab WorldArgentinaArmeniaArubaAustraliaAustriaAzerbaijanBahamas, TheBahrainBangladeshBarbadosBelarusBelgiumBelizeBeninBermudaBhutanBoliviaBosnia and HerzegovinaBotswanaBrazilBrunei DarussalamBulgariaBurkina FasoBurundiCabo VerdeCambodiaCameroonCanadaCaribbean small statesCentral African RepublicCentral Europe and the BalticsChadChileChinaColombiaComorosCongo, Dem. Rep.Congo, Rep.Costa RicaCote d'IvoireCroatiaCubaCyprusCzech RepublicDenmarkDjiboutiDominicaDominican RepublicEarly-demographic dividendEast Asia & PacificEast Asia & Pacific (excluding high income)East Asia & Pacific (IDA & IBRD countries)EcuadorEgypt, Arab Rep.El SalvadorEquatorial GuineaEritreaEstoniaEthiopiaEuro areaEurope & Central AsiaEurope & Central Asia (excluding high income)Europe & Central Asia (IDA & IBRD countries)European UnionFaroe IslandsFijiFinlandFranceGabonGambia, TheGeorgiaGermanyGhanaGreeceGrenadaGuatemalaGuineaGuinea-BissauGuyanaHaitiHeavily indebted poor countries (HIPC)High incomeHondurasHong Kong SAR, ChinaHungaryIBRD onlyIcelandIDA & IBRD totalIDA blendIDA onlyIDA totalIndiaIndonesiaIran, Islamic Rep.IrelandIsraelItalyJamaicaJapanJordanKazakhstanKenyaKiribatiKorea, Rep.KosovoKuwaitKyrgyz RepublicLao PDRLate-demographic dividendLatin America & Caribbean Latin America & Caribbean (excluding high income)Latin America & the Caribbean (IDA & IBRD countries)LatviaLeast developed countries: UN classificationLebanonLesothoLiberiaLibyaLithuaniaLow & middle incomeLow incomeLower middle incomeLuxembourgMacao SAR, ChinaMacedonia, FYRMadagascarMalawiMalaysiaMaliMaltaMauritaniaMauritiusMexicoMicronesia, Fed. Sts.Middle East & North AfricaMiddle East & North Africa (excluding high income)Middle East & North Africa (IDA & IBRD countries)Middle incomeMoldovaMongoliaMontenegroMoroccoMozambiqueNamibiaNepalNetherlandsNew CaledoniaNew ZealandNicaraguaNigerNigeriaNorth AmericaNorwayOECD membersOmanOther small statesPakistanPanamaPapua New GuineaParaguayPeruPhilippinesPolandPortugalPost-demographic dividendPre-demographic dividendPuerto RicoQatarRomaniaRussian FederationRwandaSaudi ArabiaSenegalSerbiaSeychellesSierra LeoneSingaporeSlovak RepublicSloveniaSmall statesSolomon IslandsSomaliaSouth AfricaSouth AsiaSouth Asia (IDA & IBRD)South SudanSpainSri LankaSt. Kitts and NevisSt. LuciaSt. Vincent and the GrenadinesSub-Saharan Africa Sub-Saharan Africa (excluding high income)Sub-Saharan Africa (IDA & IBRD countries)SudanSurinameSwazilandSwedenSwitzerlandSyrian Arab RepublicTajikistanTanzaniaThailandTimor-LesteTogoTongaTrinidad and TobagoTunisiaTurkeyTurkmenistanUgandaUkraineUnited Arab EmiratesUnited KingdomUnited StatesUpper middle incomeUruguayUzbekistanVanuatuVenezuela, RBVietnamWest Bank and GazaWorldYemen, Rep.ZambiaZimbabwe Timeline:
This timeline shows a graph from 1983 to 2016 of IDA only. No data until 1982. Number of actual observations by date: 34.
Source name:
World Development Indicators
Source organization:
World Bank national accounts data, and OECD National Accounts data files.
Categories, topics:
Economy & Growth
Last updated:
apr 23, 2017
Indicators value changes by year
Minimum:
119.592 bln
jan 1, 1984
Maximum:
826.962 bln
jan 1, 2016
At the date of observation
Value
Absolute change
Change from previous value
jan 1, 1983
122.857 bln
+122.857 bln
0.0%
jan 1, 1984
119.592 bln
-3.265 bln
-2.66%
jan 1, 1985
125.429 bln
+5.836 bln
4.88%
jan 1, 1986
132.095 bln
+6.667 bln
5.32%
jan 1, 1987
142.415 bln
+10.32 bln
7.81%
jan 1, 1988
154.991 bln
+12.576 bln
8.83%
jan 1, 1989
156.224 bln
+1.233 bln
0.8%
jan 1, 1990
155.083 bln
-1.141 bln
-0.73%
jan 1, 1991
164.216 bln
+9.133 bln
5.89%
jan 1, 1992
165.354 bln
+1.138 bln
0.69%
jan 1, 1993
158.995 bln
-6.359 bln
-3.85%
jan 1, 1994
158.044 bln
-950.695 mln
-0.6%
jan 1, 1995
146.648 bln
-11.396 bln
-7.21%
jan 1, 1996
170.574 bln
+23.926 bln
16.32%
jan 1, 1997
187.166 bln
+16.592 bln
9.73%
jan 1, 1998
196.314 bln
+9.148 bln
4.89%
jan 1, 1999
204.728 bln
+8.414 bln
4.29%
jan 1, 2000
204.86 bln
+131.827 mln
0.06%
jan 1, 2001
219.045 bln
+14.185 bln
6.92%
jan 1, 2002
212.644 bln
-6.401 bln
-2.92%
jan 1, 2003
226.456 bln
+13.813 bln
6.5%
jan 1, 2004
249.899 bln
+23.443 bln
10.35%
jan 1, 2005
279.695 bln
+29.796 bln
11.92%
jan 1, 2006
320.22 bln
+40.525 bln
14.49%
jan 1, 2007
369.558 bln
+49.338 bln
15.41%
jan 1, 2008
430.984 bln
+61.425 bln
16.62%
jan 1, 2009
513.268 bln
+82.284 bln
19.09%
jan 1, 2010
526.755 bln
+13.487 bln
2.63%
jan 1, 2011
585.461 bln
+58.707 bln
11.14%
jan 1, 2012
640.738 bln
+55.277 bln
9.44%
jan 1, 2013
696.476 bln
+55.738 bln
8.7%
jan 1, 2014
762.119 bln
+65.643 bln
9.43%
jan 1, 2015
782.217 bln
+20.098 bln
2.64%
jan 1, 2016
826.962 bln
+44.745 bln
5.72%
Ranking of countries by current statistics by years


Comments: