29
/
en
AIzaSyAYiBZKx7MnpbEhh9jyipgxe19OcubqV5w
April 1, 2024
256432
Sweden
SWE
true
2
1
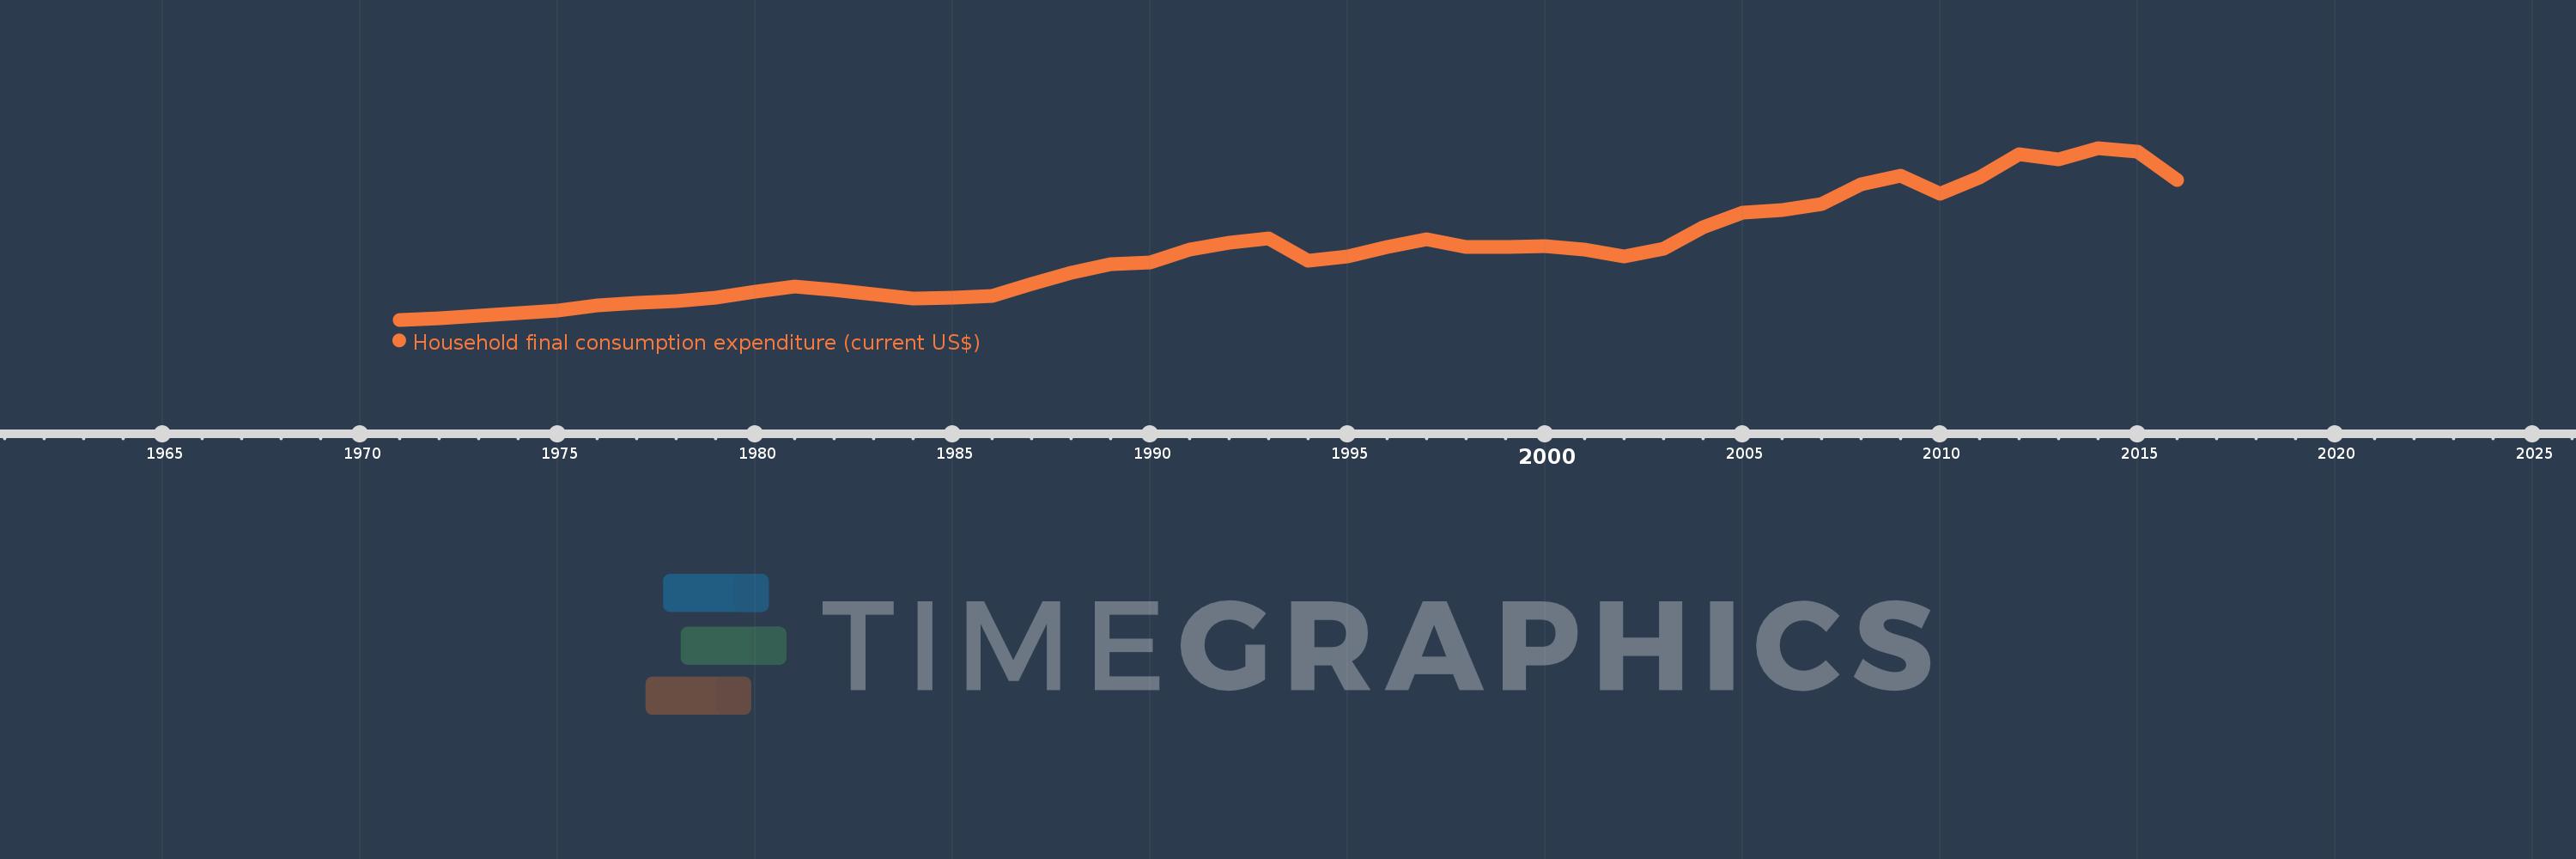
Household final consumption expenditure (current US$)
2016,2015,2014,2013,2012,2011,2010,2009,2008,2007,2006,2005,2004,2003,2002,2001,2000,1999,1998,1997,1996,1995,1994,1993,1992,1991,1990,1989,1988,1987,1986,1985,1984,1983,1982,1981,1980,1979,1978,1977,1976,1975,1974,1973,1972,1971
This statistics in other country:
AfghanistanAlbaniaAlgeriaAngolaAntigua and BarbudaArab WorldArgentinaArmeniaArubaAustraliaAustriaAzerbaijanBahamas, TheBahrainBangladeshBarbadosBelarusBelgiumBelizeBeninBermudaBhutanBoliviaBosnia and HerzegovinaBotswanaBrazilBrunei DarussalamBulgariaBurkina FasoBurundiCabo VerdeCambodiaCameroonCanadaCaribbean small statesCentral African RepublicCentral Europe and the BalticsChadChileChinaColombiaComorosCongo, Dem. Rep.Congo, Rep.Costa RicaCote d'IvoireCroatiaCubaCyprusCzech RepublicDenmarkDjiboutiDominicaDominican RepublicEarly-demographic dividendEast Asia & PacificEast Asia & Pacific (excluding high income)East Asia & Pacific (IDA & IBRD countries)EcuadorEgypt, Arab Rep.El SalvadorEquatorial GuineaEritreaEstoniaEthiopiaEuro areaEurope & Central AsiaEurope & Central Asia (excluding high income)Europe & Central Asia (IDA & IBRD countries)European UnionFaroe IslandsFijiFinlandFranceGabonGambia, TheGeorgiaGermanyGhanaGreeceGrenadaGuatemalaGuineaGuinea-BissauGuyanaHaitiHeavily indebted poor countries (HIPC)High incomeHondurasHong Kong SAR, ChinaHungaryIBRD onlyIcelandIDA & IBRD totalIDA blendIDA onlyIDA totalIndiaIndonesiaIran, Islamic Rep.IrelandIsraelItalyJamaicaJapanJordanKazakhstanKenyaKiribatiKorea, Rep.KosovoKuwaitKyrgyz RepublicLao PDRLate-demographic dividendLatin America & Caribbean Latin America & Caribbean (excluding high income)Latin America & the Caribbean (IDA & IBRD countries)LatviaLeast developed countries: UN classificationLebanonLesothoLiberiaLibyaLithuaniaLow & middle incomeLow incomeLower middle incomeLuxembourgMacao SAR, ChinaMacedonia, FYRMadagascarMalawiMalaysiaMaliMaltaMauritaniaMauritiusMexicoMicronesia, Fed. Sts.Middle East & North AfricaMiddle East & North Africa (excluding high income)Middle East & North Africa (IDA & IBRD countries)Middle incomeMoldovaMongoliaMontenegroMoroccoMozambiqueNamibiaNepalNetherlandsNew CaledoniaNew ZealandNicaraguaNigerNigeriaNorth AmericaNorwayOECD membersOmanOther small statesPakistanPanamaPapua New GuineaParaguayPeruPhilippinesPolandPortugalPost-demographic dividendPre-demographic dividendPuerto RicoQatarRomaniaRussian FederationRwandaSaudi ArabiaSenegalSerbiaSeychellesSierra LeoneSingaporeSlovak RepublicSloveniaSmall statesSolomon IslandsSomaliaSouth AfricaSouth AsiaSouth Asia (IDA & IBRD)South SudanSpainSri LankaSt. Kitts and NevisSt. LuciaSt. Vincent and the GrenadinesSub-Saharan Africa Sub-Saharan Africa (excluding high income)Sub-Saharan Africa (IDA & IBRD countries)SudanSurinameSwazilandSwedenSwitzerlandSyrian Arab RepublicTajikistanTanzaniaThailandTimor-LesteTogoTongaTrinidad and TobagoTunisiaTurkeyTurkmenistanUgandaUkraineUnited Arab EmiratesUnited KingdomUnited StatesUpper middle incomeUruguayUzbekistanVanuatuVenezuela, RBVietnamWest Bank and GazaWorldYemen, Rep.ZambiaZimbabwe Timeline:
This timeline shows a graph from 1971 to 2016 of Sweden. No data until 1970. Number of actual observations by date: 46.
Source name:
World Development Indicators
Source organization:
World Bank national accounts data, and OECD National Accounts data files.
Categories, topics:
Economy & Growth
Last updated:
apr 23, 2017
Indicators value changes by year
Minimum:
18.685 bln
jan 1, 1971
Maximum:
270.082 bln
jan 1, 2014
At the date of observation
Value
Absolute change
Change from previous value
jan 1, 1971
18.685 bln
+18.685 bln
0.0%
jan 1, 1972
20.316 bln
+1.631 bln
8.73%
jan 1, 1973
24.068 bln
+3.752 bln
18.47%
jan 1, 1974
28.958 bln
+4.891 bln
20.32%
jan 1, 1975
32.488 bln
+3.53 bln
12.19%
jan 1, 1976
39.602 bln
+7.114 bln
21.9%
jan 1, 1977
43.658 bln
+4.056 bln
10.24%
jan 1, 1978
46.518 bln
+2.86 bln
6.55%
jan 1, 1979
51.136 bln
+4.618 bln
9.93%
jan 1, 1980
59.586 bln
+8.45 bln
16.52%
jan 1, 1981
67.351 bln
+7.765 bln
13.03%
jan 1, 1982
62.747 bln
-4.604 bln
-6.84%
jan 1, 1983
56.238 bln
-6.509 bln
-10.37%
jan 1, 1984
49.979 bln
-6.259 bln
-11.13%
jan 1, 1985
50.612 bln
+632.366 mln
1.27%
jan 1, 1986
53.338 bln
+2.727 bln
5.39%
jan 1, 1987
70.871 bln
+17.533 bln
32.87%
jan 1, 1988
88.066 bln
+17.195 bln
24.26%
jan 1, 1989
99.443 bln
+11.377 bln
12.92%
jan 1, 1990
101.978 bln
+2.534 bln
2.55%
jan 1, 1991
121.336 bln
+19.359 bln
18.98%
jan 1, 1992
131.511 bln
+10.174 bln
8.39%
jan 1, 1993
137.595 bln
+6.084 bln
4.63%
jan 1, 1994
105.367 bln
-32.228 bln
-23.42%
jan 1, 1995
111.285 bln
+5.918 bln
5.62%
jan 1, 1996
125.286 bln
+14.001 bln
12.58%
jan 1, 1997
136.927 bln
+11.641 bln
9.29%
jan 1, 1998
125.425 bln
-11.501 bln
-8.4%
jan 1, 1999
125.0 bln
-425.921 mln
-0.34%
jan 1, 2000
126.965 bln
+1.965 bln
1.57%
jan 1, 2001
121.692 bln
-5.273 bln
-4.15%
jan 1, 2002
111.073 bln
-10.619 bln
-8.73%
jan 1, 2003
122.642 bln
+11.569 bln
10.42%
jan 1, 2004
153.546 bln
+30.905 bln
25.2%
jan 1, 2005
175.018 bln
+21.472 bln
13.98%
jan 1, 2006
178.835 bln
+3.817 bln
2.18%
jan 1, 2007
188.213 bln
+9.379 bln
5.24%
jan 1, 2008
216.342 bln
+28.129 bln
14.95%
jan 1, 2009
229.295 bln
+12.952 bln
5.99%
jan 1, 2010
202.564 bln
-26.73 bln
-11.66%
jan 1, 2011
226.797 bln
+24.233 bln
11.96%
jan 1, 2012
260.706 bln
+33.909 bln
14.95%
jan 1, 2013
253.14 bln
-7.566 bln
-2.9%
jan 1, 2014
270.082 bln
+16.942 bln
6.69%
jan 1, 2015
264.719 bln
-5.363 bln
-1.99%
jan 1, 2016
223.379 bln
-41.34 bln
-15.62%
Ranking of countries by current statistics by years


Comments: