29
/
en
AIzaSyAYiBZKx7MnpbEhh9jyipgxe19OcubqV5w
April 1, 2024
240541
Singapore
SGP
true
2
1
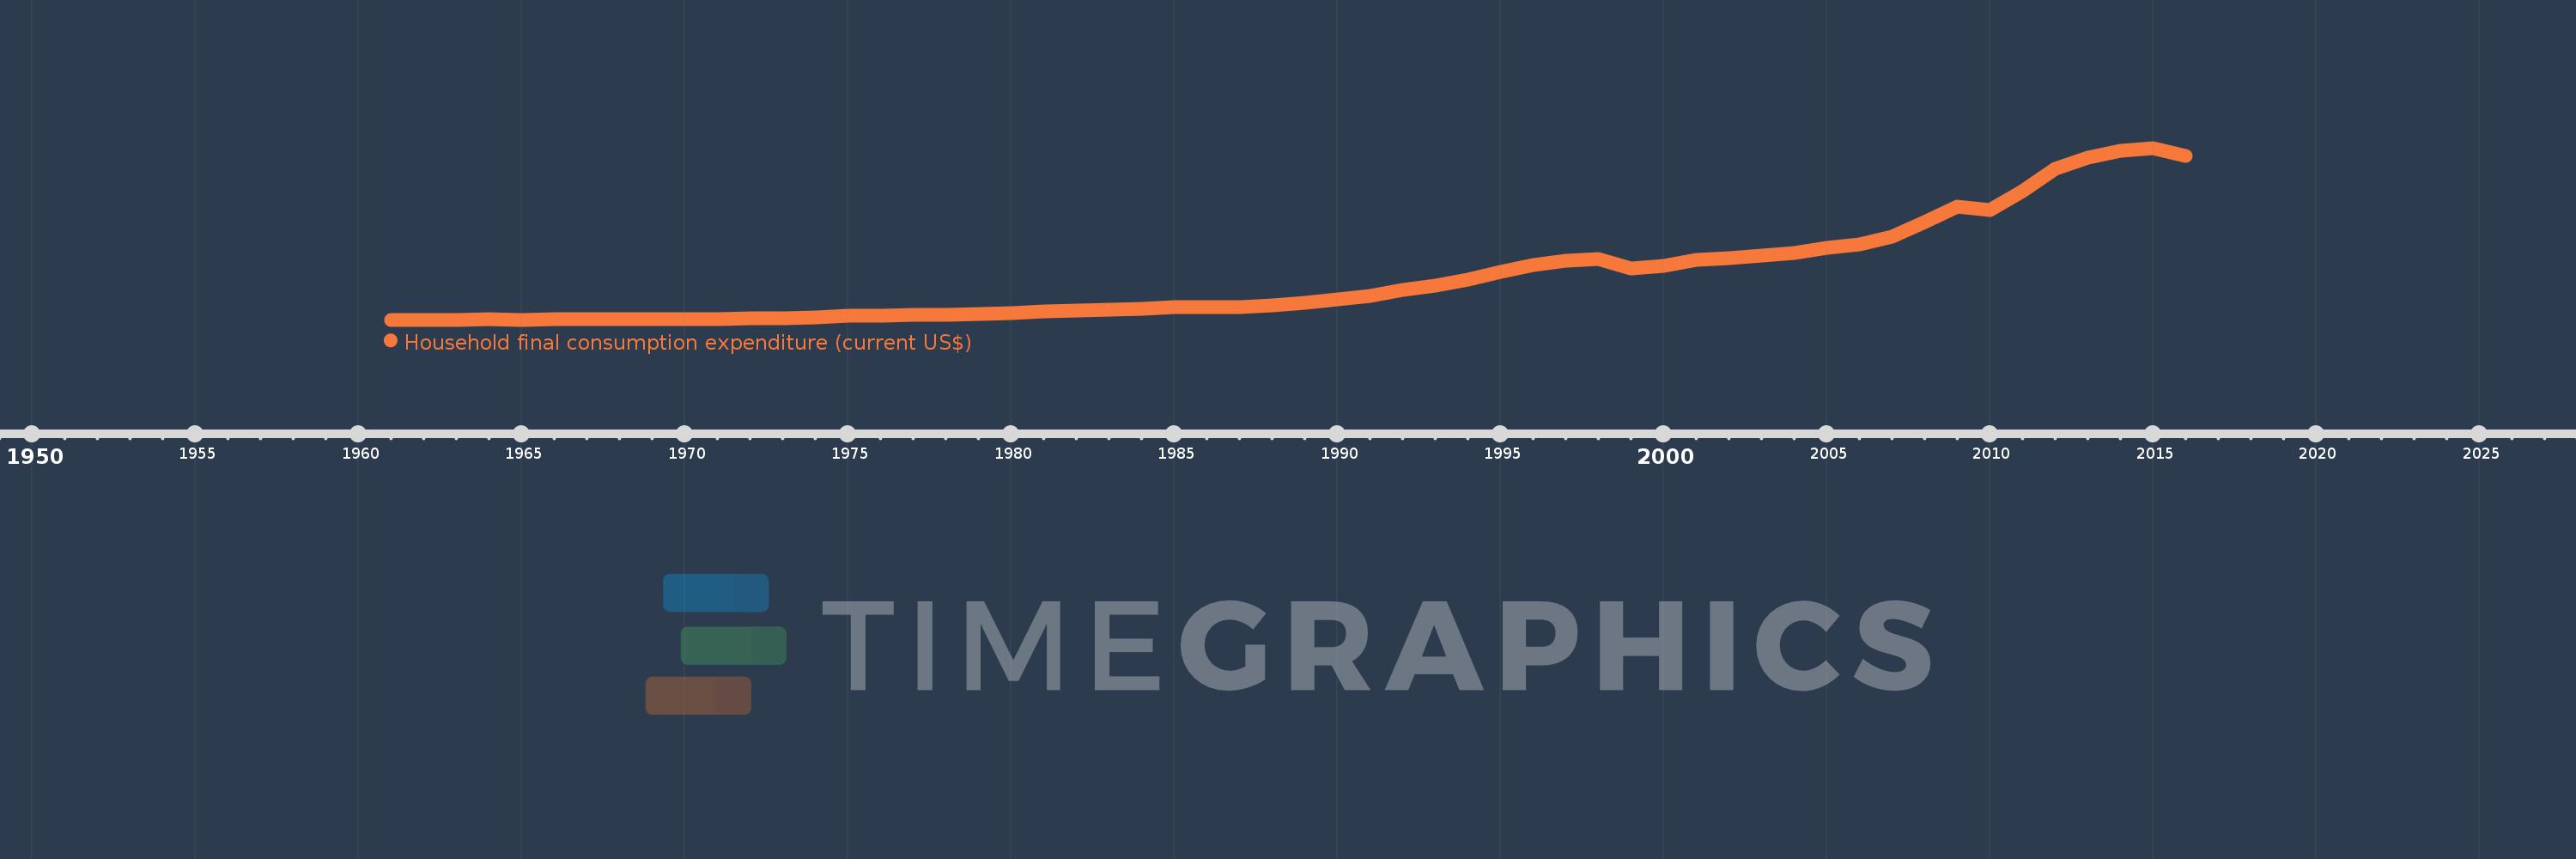
Household final consumption expenditure (current US$)
2016,2015,2014,2013,2012,2011,2010,2009,2008,2007,2006,2005,2004,2003,2002,2001,2000,1999,1998,1997,1996,1995,1994,1993,1992,1991,1990,1989,1988,1987,1986,1985,1984,1983,1982,1981,1980,1979,1978,1977,1976,1975,1974,1973,1972,1971,1970,1969,1968,1967,1966,1965,1964,1963,1962,1961
This statistics in other country:
AfghanistanAlbaniaAlgeriaAngolaAntigua and BarbudaArab WorldArgentinaArmeniaArubaAustraliaAustriaAzerbaijanBahamas, TheBahrainBangladeshBarbadosBelarusBelgiumBelizeBeninBermudaBhutanBoliviaBosnia and HerzegovinaBotswanaBrazilBrunei DarussalamBulgariaBurkina FasoBurundiCabo VerdeCambodiaCameroonCanadaCaribbean small statesCentral African RepublicCentral Europe and the BalticsChadChileChinaColombiaComorosCongo, Dem. Rep.Congo, Rep.Costa RicaCote d'IvoireCroatiaCubaCyprusCzech RepublicDenmarkDjiboutiDominicaDominican RepublicEarly-demographic dividendEast Asia & PacificEast Asia & Pacific (excluding high income)East Asia & Pacific (IDA & IBRD countries)EcuadorEgypt, Arab Rep.El SalvadorEquatorial GuineaEritreaEstoniaEthiopiaEuro areaEurope & Central AsiaEurope & Central Asia (excluding high income)Europe & Central Asia (IDA & IBRD countries)European UnionFaroe IslandsFijiFinlandFranceGabonGambia, TheGeorgiaGermanyGhanaGreeceGrenadaGuatemalaGuineaGuinea-BissauGuyanaHaitiHeavily indebted poor countries (HIPC)High incomeHondurasHong Kong SAR, ChinaHungaryIBRD onlyIcelandIDA & IBRD totalIDA blendIDA onlyIDA totalIndiaIndonesiaIran, Islamic Rep.IrelandIsraelItalyJamaicaJapanJordanKazakhstanKenyaKiribatiKorea, Rep.KosovoKuwaitKyrgyz RepublicLao PDRLate-demographic dividendLatin America & Caribbean Latin America & Caribbean (excluding high income)Latin America & the Caribbean (IDA & IBRD countries)LatviaLeast developed countries: UN classificationLebanonLesothoLiberiaLibyaLithuaniaLow & middle incomeLow incomeLower middle incomeLuxembourgMacao SAR, ChinaMacedonia, FYRMadagascarMalawiMalaysiaMaliMaltaMauritaniaMauritiusMexicoMicronesia, Fed. Sts.Middle East & North AfricaMiddle East & North Africa (excluding high income)Middle East & North Africa (IDA & IBRD countries)Middle incomeMoldovaMongoliaMontenegroMoroccoMozambiqueNamibiaNepalNetherlandsNew CaledoniaNew ZealandNicaraguaNigerNigeriaNorth AmericaNorwayOECD membersOmanOther small statesPakistanPanamaPapua New GuineaParaguayPeruPhilippinesPolandPortugalPost-demographic dividendPre-demographic dividendPuerto RicoQatarRomaniaRussian FederationRwandaSaudi ArabiaSenegalSerbiaSeychellesSierra LeoneSingaporeSlovak RepublicSloveniaSmall statesSolomon IslandsSomaliaSouth AfricaSouth AsiaSouth Asia (IDA & IBRD)South SudanSpainSri LankaSt. Kitts and NevisSt. LuciaSt. Vincent and the GrenadinesSub-Saharan Africa Sub-Saharan Africa (excluding high income)Sub-Saharan Africa (IDA & IBRD countries)SudanSurinameSwazilandSwedenSwitzerlandSyrian Arab RepublicTajikistanTanzaniaThailandTimor-LesteTogoTongaTrinidad and TobagoTunisiaTurkeyTurkmenistanUgandaUkraineUnited Arab EmiratesUnited KingdomUnited StatesUpper middle incomeUruguayUzbekistanVanuatuVenezuela, RBVietnamWest Bank and GazaWorldYemen, Rep.ZambiaZimbabwe Timeline:
This timeline shows a graph from 1961 to 2016 of Singapore. No data until 1960. Number of actual observations by date: 56.
Source name:
World Development Indicators
Source organization:
World Bank national accounts data, and OECD National Accounts data files.
Categories, topics:
Economy & Growth
Last updated:
apr 23, 2017
Indicators value changes by year
Minimum:
630.243 mln
jan 1, 1961
Maximum:
112.305 bln
jan 1, 2015
At the date of observation
Value
Absolute change
Change from previous value
jan 1, 1961
630.243 mln
+630.243 mln
0.0%
jan 1, 1962
691.592 mln
+61.348 mln
9.73%
jan 1, 1963
720.208 mln
+28.616 mln
4.14%
jan 1, 1964
763.426 mln
+43.218 mln
6.0%
jan 1, 1965
734.712 mln
-28.714 mln
-3.76%
jan 1, 1966
768.457 mln
+33.745 mln
4.59%
jan 1, 1967
839.54 mln
+71.083 mln
9.25%
jan 1, 1968
937.181 mln
+97.641 mln
11.63%
jan 1, 1969
1.045 bln
+107.376 mln
11.46%
jan 1, 1970
1.131 bln
+86.273 mln
8.26%
jan 1, 1971
1.29 bln
+158.729 mln
14.04%
jan 1, 1972
1.491 bln
+201.457 mln
15.62%
jan 1, 1973
1.675 bln
+184.402 mln
12.37%
jan 1, 1974
2.275 bln
+599.959 mln
35.81%
jan 1, 1975
3.158 bln
+882.228 mln
38.77%
jan 1, 1976
3.385 bln
+227.104 mln
7.19%
jan 1, 1977
3.684 bln
+299.176 mln
8.84%
jan 1, 1978
3.799 bln
+115.328 mln
3.13%
jan 1, 1979
4.209 bln
+410.14 mln
10.8%
jan 1, 1980
5.027 bln
+817.866 mln
19.43%
jan 1, 1981
6.007 bln
+980.229 mln
19.5%
jan 1, 1982
6.793 bln
+785.797 mln
13.08%
jan 1, 1983
7.358 bln
+564.4 mln
8.31%
jan 1, 1984
7.775 bln
+417.166 mln
5.67%
jan 1, 1985
8.598 bln
+823.436 mln
10.59%
jan 1, 1986
8.588 bln
-9.903 mln
-0.12%
jan 1, 1987
8.674 bln
+85.942 mln
1.0%
jan 1, 1988
9.873 bln
+1.199 bln
13.82%
jan 1, 1989
11.825 bln
+1.951 bln
19.76%
jan 1, 1990
14.009 bln
+2.185 bln
18.48%
jan 1, 1991
16.18 bln
+2.171 bln
15.5%
jan 1, 1992
19.739 bln
+3.558 bln
21.99%
jan 1, 1993
22.667 bln
+2.929 bln
14.84%
jan 1, 1994
26.509 bln
+3.842 bln
16.95%
jan 1, 1995
31.803 bln
+5.294 bln
19.97%
jan 1, 1996
35.997 bln
+4.194 bln
13.19%
jan 1, 1997
38.986 bln
+2.99 bln
8.31%
jan 1, 1998
39.987 bln
+1.001 bln
2.57%
jan 1, 1999
33.72 bln
-6.267 bln
-15.67%
jan 1, 2000
35.649 bln
+1.929 bln
5.72%
jan 1, 2001
39.812 bln
+4.163 bln
11.68%
jan 1, 2002
40.618 bln
+805.896 mln
2.02%
jan 1, 2003
42.444 bln
+1.826 bln
4.5%
jan 1, 2004
43.907 bln
+1.462 bln
3.45%
jan 1, 2005
47.552 bln
+3.646 bln
8.3%
jan 1, 2006
49.867 bln
+2.315 bln
4.87%
jan 1, 2007
54.799 bln
+4.932 bln
9.89%
jan 1, 2008
64.017 bln
+9.218 bln
16.82%
jan 1, 2009
73.929 bln
+9.911 bln
15.48%
jan 1, 2010
72.11 bln
-1.819 bln
-2.46%
jan 1, 2011
83.989 bln
+11.879 bln
16.47%
jan 1, 2012
98.82 bln
+14.832 bln
17.66%
jan 1, 2013
106.203 bln
+7.383 bln
7.47%
jan 1, 2014
110.603 bln
+4.399 bln
4.14%
jan 1, 2015
112.305 bln
+1.703 bln
1.54%
jan 1, 2016
107.347 bln
-4.959 bln
-4.42%
Ranking of countries by current statistics by years


Comments: