29
/
en
AIzaSyAYiBZKx7MnpbEhh9jyipgxe19OcubqV5w
April 1, 2024
162655
Jamaica
JAM
true
2
1
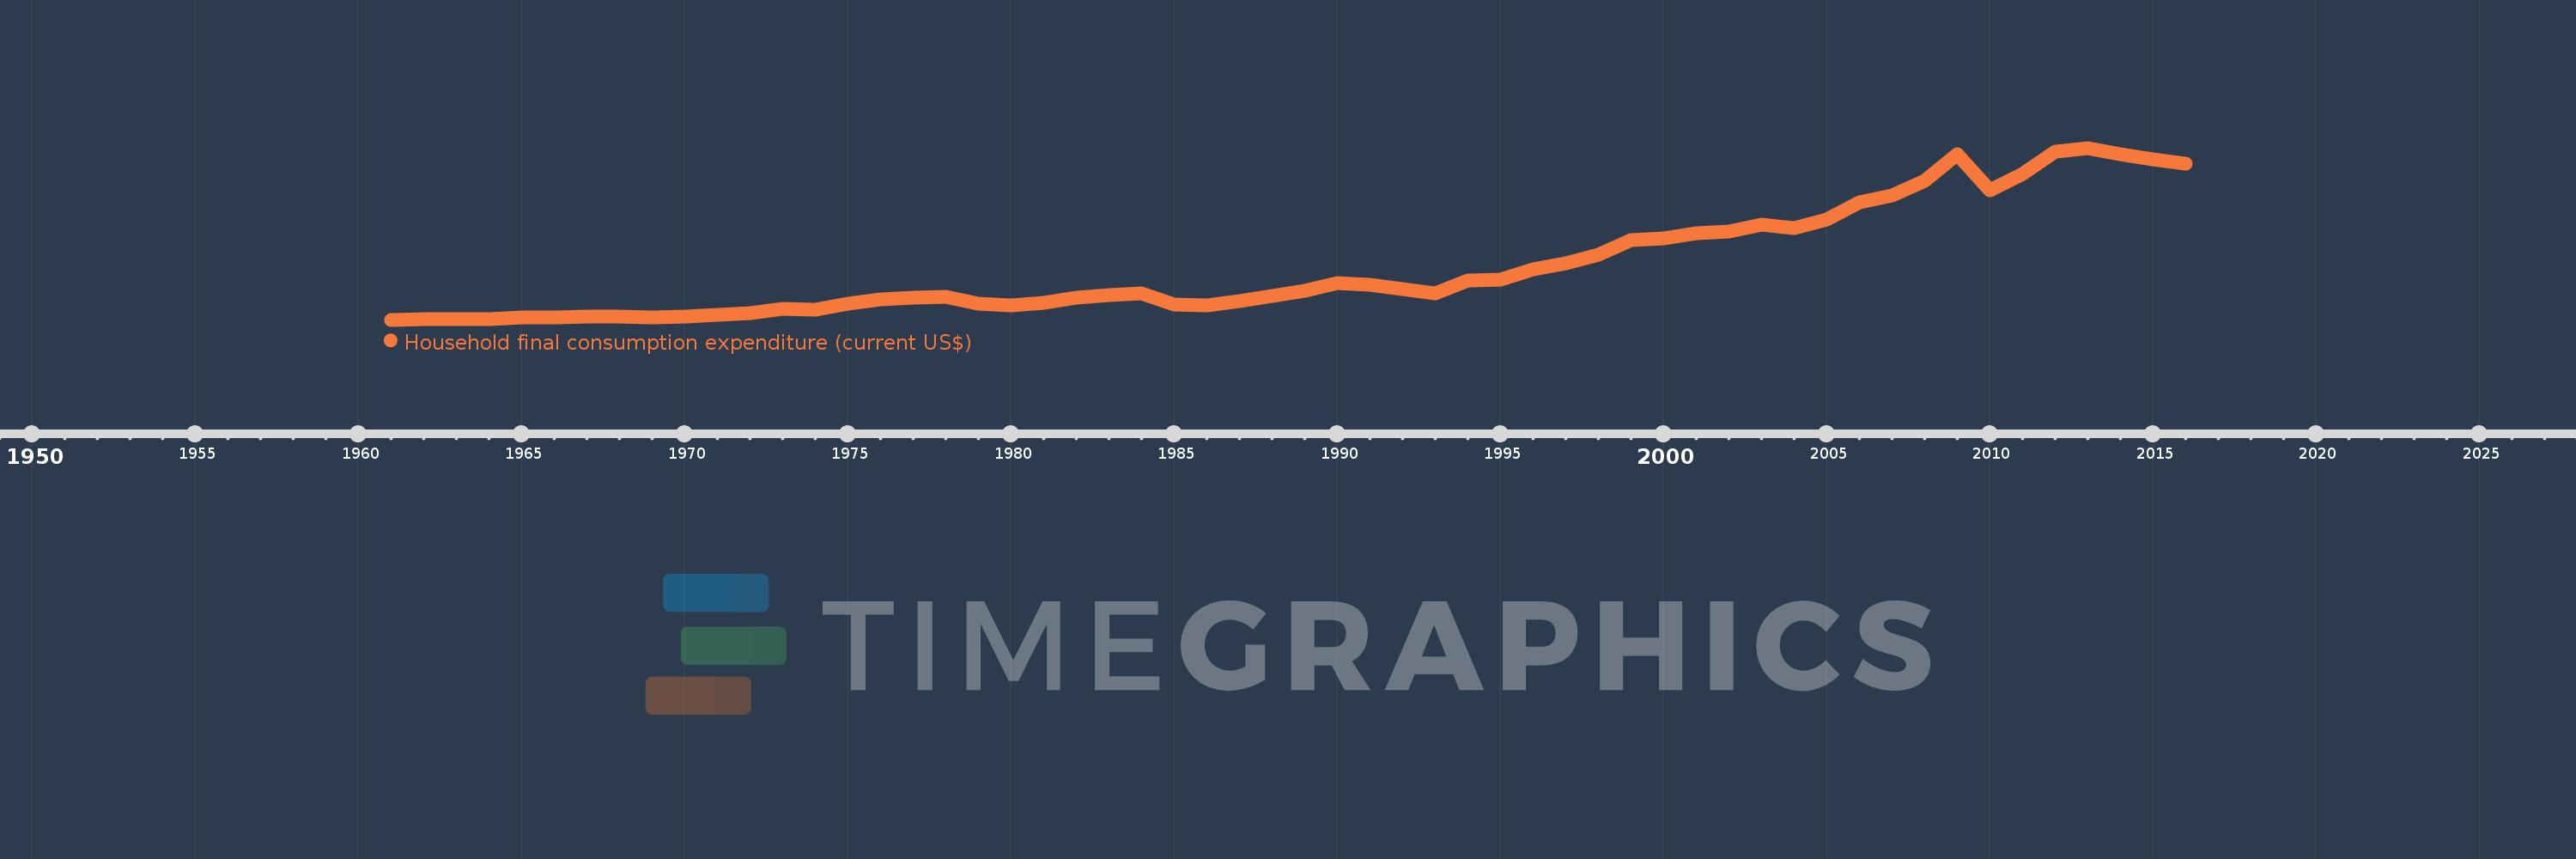
Household final consumption expenditure (current US$)
2016,2015,2014,2013,2012,2011,2010,2009,2008,2007,2006,2005,2004,2003,2002,2001,2000,1999,1998,1997,1996,1995,1994,1993,1992,1991,1990,1989,1988,1987,1986,1985,1984,1983,1982,1981,1980,1979,1978,1977,1976,1975,1974,1973,1972,1971,1970,1969,1968,1967,1966,1965,1964,1963,1962,1961
This statistics in other country:
AfghanistanAlbaniaAlgeriaAngolaAntigua and BarbudaArab WorldArgentinaArmeniaArubaAustraliaAustriaAzerbaijanBahamas, TheBahrainBangladeshBarbadosBelarusBelgiumBelizeBeninBermudaBhutanBoliviaBosnia and HerzegovinaBotswanaBrazilBrunei DarussalamBulgariaBurkina FasoBurundiCabo VerdeCambodiaCameroonCanadaCaribbean small statesCentral African RepublicCentral Europe and the BalticsChadChileChinaColombiaComorosCongo, Dem. Rep.Congo, Rep.Costa RicaCote d'IvoireCroatiaCubaCyprusCzech RepublicDenmarkDjiboutiDominicaDominican RepublicEarly-demographic dividendEast Asia & PacificEast Asia & Pacific (excluding high income)East Asia & Pacific (IDA & IBRD countries)EcuadorEgypt, Arab Rep.El SalvadorEquatorial GuineaEritreaEstoniaEthiopiaEuro areaEurope & Central AsiaEurope & Central Asia (excluding high income)Europe & Central Asia (IDA & IBRD countries)European UnionFaroe IslandsFijiFinlandFranceGabonGambia, TheGeorgiaGermanyGhanaGreeceGrenadaGuatemalaGuineaGuinea-BissauGuyanaHaitiHeavily indebted poor countries (HIPC)High incomeHondurasHong Kong SAR, ChinaHungaryIBRD onlyIcelandIDA & IBRD totalIDA blendIDA onlyIDA totalIndiaIndonesiaIran, Islamic Rep.IrelandIsraelItalyJamaicaJapanJordanKazakhstanKenyaKiribatiKorea, Rep.KosovoKuwaitKyrgyz RepublicLao PDRLate-demographic dividendLatin America & Caribbean Latin America & Caribbean (excluding high income)Latin America & the Caribbean (IDA & IBRD countries)LatviaLeast developed countries: UN classificationLebanonLesothoLiberiaLibyaLithuaniaLow & middle incomeLow incomeLower middle incomeLuxembourgMacao SAR, ChinaMacedonia, FYRMadagascarMalawiMalaysiaMaliMaltaMauritaniaMauritiusMexicoMicronesia, Fed. Sts.Middle East & North AfricaMiddle East & North Africa (excluding high income)Middle East & North Africa (IDA & IBRD countries)Middle incomeMoldovaMongoliaMontenegroMoroccoMozambiqueNamibiaNepalNetherlandsNew CaledoniaNew ZealandNicaraguaNigerNigeriaNorth AmericaNorwayOECD membersOmanOther small statesPakistanPanamaPapua New GuineaParaguayPeruPhilippinesPolandPortugalPost-demographic dividendPre-demographic dividendPuerto RicoQatarRomaniaRussian FederationRwandaSaudi ArabiaSenegalSerbiaSeychellesSierra LeoneSingaporeSlovak RepublicSloveniaSmall statesSolomon IslandsSomaliaSouth AfricaSouth AsiaSouth Asia (IDA & IBRD)South SudanSpainSri LankaSt. Kitts and NevisSt. LuciaSt. Vincent and the GrenadinesSub-Saharan Africa Sub-Saharan Africa (excluding high income)Sub-Saharan Africa (IDA & IBRD countries)SudanSurinameSwazilandSwedenSwitzerlandSyrian Arab RepublicTajikistanTanzaniaThailandTimor-LesteTogoTongaTrinidad and TobagoTunisiaTurkeyTurkmenistanUgandaUkraineUnited Arab EmiratesUnited KingdomUnited StatesUpper middle incomeUruguayUzbekistanVanuatuVenezuela, RBVietnamWest Bank and GazaWorldYemen, Rep.ZambiaZimbabwe Timeline:
This timeline shows a graph from 1961 to 2016 of Jamaica. No data until 1960. Number of actual observations by date: 56.
Source name:
World Development Indicators
Source organization:
World Bank national accounts data, and OECD National Accounts data files.
Categories, topics:
Economy & Growth
Last updated:
apr 23, 2017
Indicators value changes by year
Minimum:
483.281 mln
jan 1, 1961
Maximum:
12.648 bln
jan 1, 2013
At the date of observation
Value
Absolute change
Change from previous value
jan 1, 1961
483.281 mln
+483.281 mln
0.0%
jan 1, 1962
499.294 mln
+16.012 mln
3.31%
jan 1, 1963
524.04 mln
+24.746 mln
4.96%
jan 1, 1964
551.698 mln
+27.658 mln
5.28%
jan 1, 1965
634.671 mln
+82.973 mln
15.04%
jan 1, 1966
669.607 mln
+34.936 mln
5.5%
jan 1, 1967
684.446 mln
+14.84 mln
2.22%
jan 1, 1968
719.553 mln
+35.106 mln
5.13%
jan 1, 1969
660.146 mln
-59.406 mln
-8.26%
jan 1, 1970
729.149 mln
+69.003 mln
10.45%
jan 1, 1971
855.754 mln
+126.605 mln
17.36%
jan 1, 1972
964.337 mln
+108.583 mln
12.69%
jan 1, 1973
1.261 bln
+296.77 mln
30.77%
jan 1, 1974
1.178 bln
-83.47 mln
-6.62%
jan 1, 1975
1.616 bln
+438.026 mln
37.2%
jan 1, 1976
1.895 bln
+278.847 mln
17.26%
jan 1, 1977
2.07 bln
+175.338 mln
9.26%
jan 1, 1978
2.134 bln
+63.909 mln
3.09%
jan 1, 1979
1.631 bln
-502.966 mln
-23.57%
jan 1, 1980
1.512 bln
-119.29 mln
-7.31%
jan 1, 1981
1.71 bln
+198.669 mln
13.14%
jan 1, 1982
2.016 bln
+306.276 mln
17.91%
jan 1, 1983
2.232 bln
+215.841 mln
10.7%
jan 1, 1984
2.351 bln
+118.968 mln
5.33%
jan 1, 1985
1.577 bln
-774.333 mln
-32.93%
jan 1, 1986
1.484 bln
-93.368 mln
-5.92%
jan 1, 1987
1.814 bln
+330.219 mln
22.26%
jan 1, 1988
2.142 bln
+328.332 mln
18.1%
jan 1, 1989
2.533 bln
+391.125 mln
18.26%
jan 1, 1990
3.05 bln
+517.25 mln
20.42%
jan 1, 1991
2.98 bln
-70.457 mln
-2.31%
jan 1, 1992
2.681 bln
-299.321 mln
-10.04%
jan 1, 1993
2.344 bln
-337.085 mln
-12.57%
jan 1, 1994
3.27 bln
+926.616 mln
39.54%
jan 1, 1995
3.342 bln
+71.369 mln
2.18%
jan 1, 1996
4.058 bln
+716.478 mln
21.44%
jan 1, 1997
4.488 bln
+429.663 mln
10.59%
jan 1, 1998
5.076 bln
+588.059 mln
13.1%
jan 1, 1999
6.111 bln
+1.035 bln
20.39%
jan 1, 2000
6.255 bln
+144.156 mln
2.36%
jan 1, 2001
6.627 bln
+371.652 mln
5.94%
jan 1, 2002
6.708 bln
+81.74 mln
1.23%
jan 1, 2003
7.199 bln
+490.279 mln
7.31%
jan 1, 2004
6.999 bln
-199.738 mln
-2.77%
jan 1, 2005
7.601 bln
+601.906 mln
8.6%
jan 1, 2006
8.828 bln
+1.227 bln
16.14%
jan 1, 2007
9.307 bln
+478.892 mln
5.42%
jan 1, 2008
10.301 bln
+994.788 mln
10.69%
jan 1, 2009
12.192 bln
+1.891 bln
18.36%
jan 1, 2010
9.671 bln
-2.521 bln
-20.68%
jan 1, 2011
10.807 bln
+1.136 bln
11.75%
jan 1, 2012
12.395 bln
+1.588 bln
14.7%
jan 1, 2013
12.648 bln
+252.573 mln
2.04%
jan 1, 2014
12.182 bln
-465.928 mln
-3.68%
jan 1, 2015
11.846 bln
-335.51 mln
-2.75%
jan 1, 2016
11.517 bln
-329.223 mln
-2.78%
Ranking of countries by current statistics by years


Comments: