29
/
en
AIzaSyAYiBZKx7MnpbEhh9jyipgxe19OcubqV5w
April 1, 2024
59854
Sub-Saharan Africa (excluding high income)
SSA
false
2
1
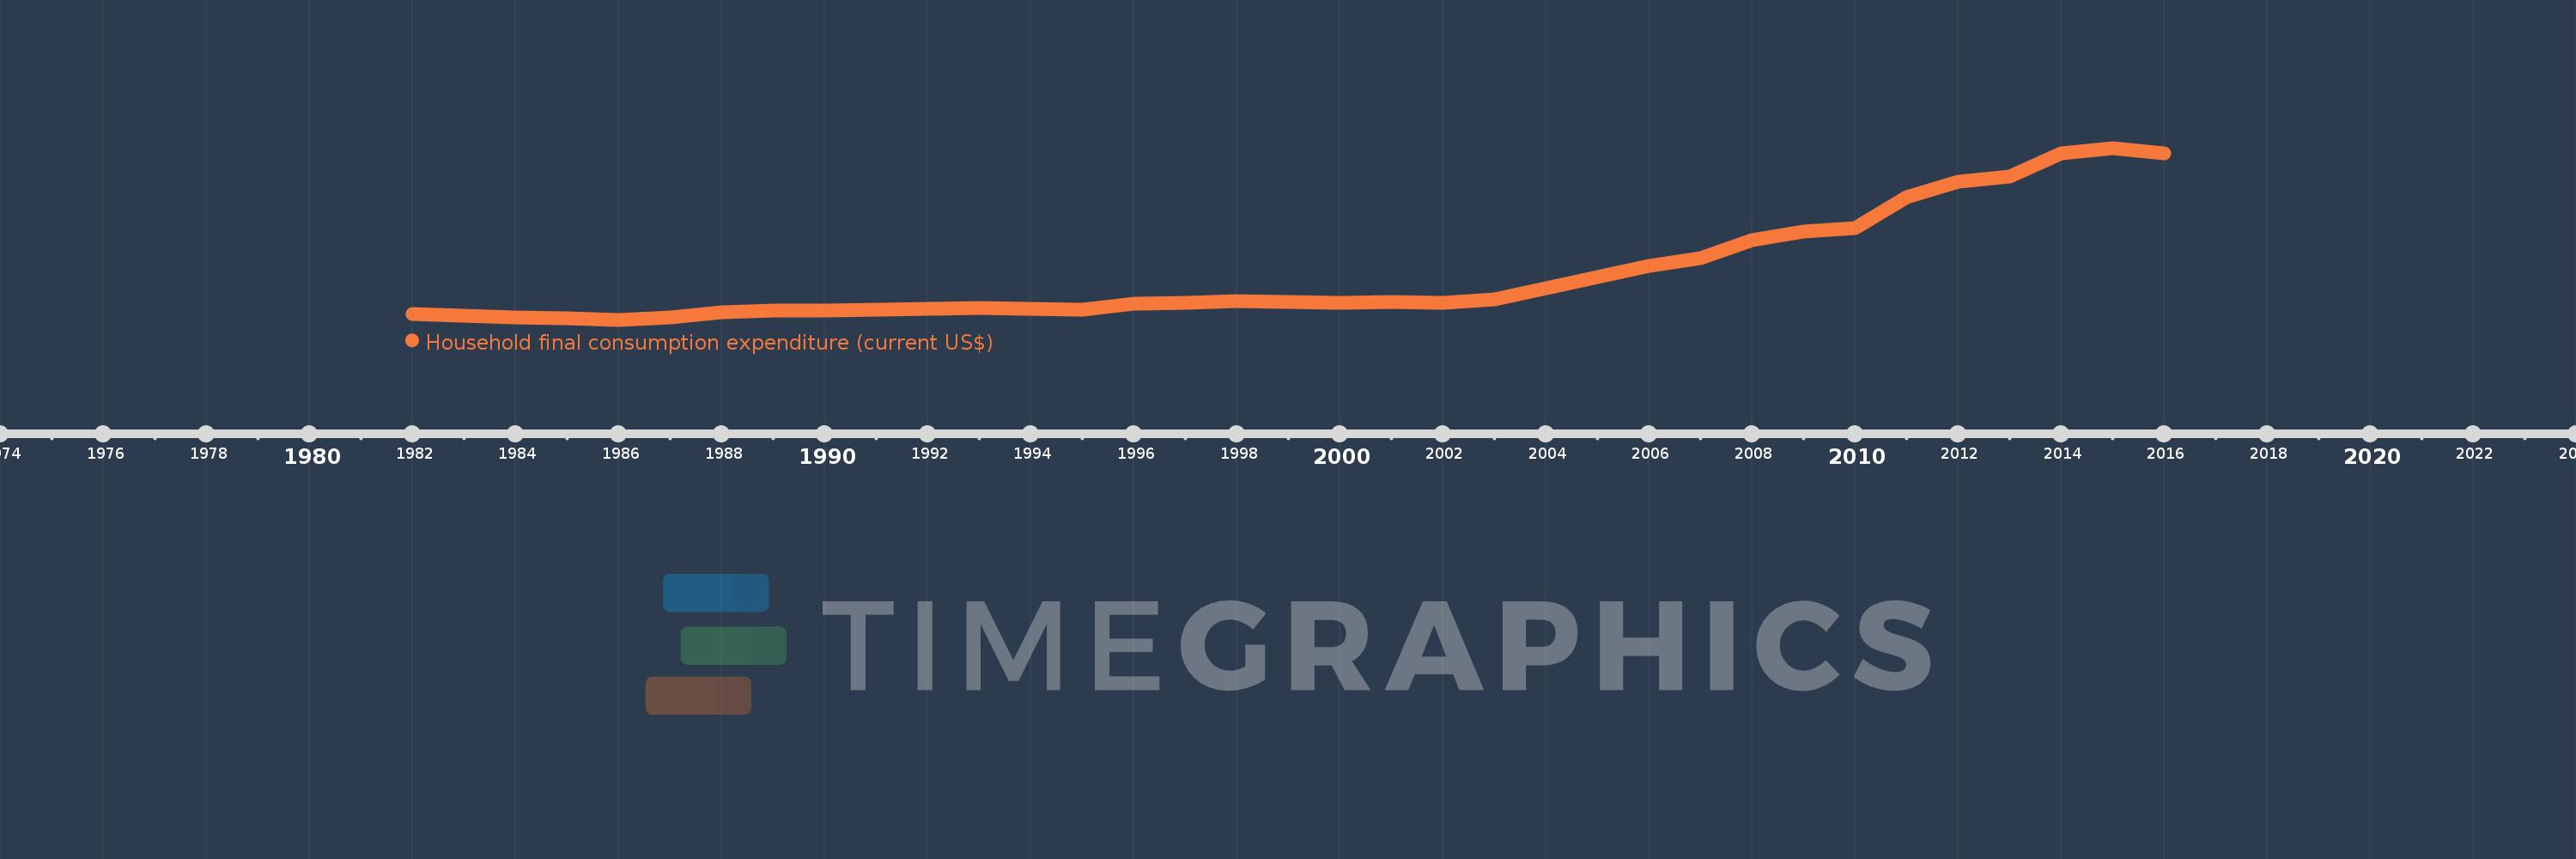
Household final consumption expenditure (current US$)
2016,2015,2014,2013,2012,2011,2010,2009,2008,2007,2006,2005,2004,2003,2002,2001,2000,1999,1998,1997,1996,1995,1994,1993,1992,1991,1990,1989,1988,1987,1986,1985,1984,1983,1982
This statistics in other country:
AfghanistanAlbaniaAlgeriaAngolaAntigua and BarbudaArab WorldArgentinaArmeniaArubaAustraliaAustriaAzerbaijanBahamas, TheBahrainBangladeshBarbadosBelarusBelgiumBelizeBeninBermudaBhutanBoliviaBosnia and HerzegovinaBotswanaBrazilBrunei DarussalamBulgariaBurkina FasoBurundiCabo VerdeCambodiaCameroonCanadaCaribbean small statesCentral African RepublicCentral Europe and the BalticsChadChileChinaColombiaComorosCongo, Dem. Rep.Congo, Rep.Costa RicaCote d'IvoireCroatiaCubaCyprusCzech RepublicDenmarkDjiboutiDominicaDominican RepublicEarly-demographic dividendEast Asia & PacificEast Asia & Pacific (excluding high income)East Asia & Pacific (IDA & IBRD countries)EcuadorEgypt, Arab Rep.El SalvadorEquatorial GuineaEritreaEstoniaEthiopiaEuro areaEurope & Central AsiaEurope & Central Asia (excluding high income)Europe & Central Asia (IDA & IBRD countries)European UnionFaroe IslandsFijiFinlandFranceGabonGambia, TheGeorgiaGermanyGhanaGreeceGrenadaGuatemalaGuineaGuinea-BissauGuyanaHaitiHeavily indebted poor countries (HIPC)High incomeHondurasHong Kong SAR, ChinaHungaryIBRD onlyIcelandIDA & IBRD totalIDA blendIDA onlyIDA totalIndiaIndonesiaIran, Islamic Rep.IrelandIsraelItalyJamaicaJapanJordanKazakhstanKenyaKiribatiKorea, Rep.KosovoKuwaitKyrgyz RepublicLao PDRLate-demographic dividendLatin America & Caribbean Latin America & Caribbean (excluding high income)Latin America & the Caribbean (IDA & IBRD countries)LatviaLeast developed countries: UN classificationLebanonLesothoLiberiaLibyaLithuaniaLow & middle incomeLow incomeLower middle incomeLuxembourgMacao SAR, ChinaMacedonia, FYRMadagascarMalawiMalaysiaMaliMaltaMauritaniaMauritiusMexicoMicronesia, Fed. Sts.Middle East & North AfricaMiddle East & North Africa (excluding high income)Middle East & North Africa (IDA & IBRD countries)Middle incomeMoldovaMongoliaMontenegroMoroccoMozambiqueNamibiaNepalNetherlandsNew CaledoniaNew ZealandNicaraguaNigerNigeriaNorth AmericaNorwayOECD membersOmanOther small statesPakistanPanamaPapua New GuineaParaguayPeruPhilippinesPolandPortugalPost-demographic dividendPre-demographic dividendPuerto RicoQatarRomaniaRussian FederationRwandaSaudi ArabiaSenegalSerbiaSeychellesSierra LeoneSingaporeSlovak RepublicSloveniaSmall statesSolomon IslandsSomaliaSouth AfricaSouth AsiaSouth Asia (IDA & IBRD)South SudanSpainSri LankaSt. Kitts and NevisSt. LuciaSt. Vincent and the GrenadinesSub-Saharan Africa Sub-Saharan Africa (excluding high income)Sub-Saharan Africa (IDA & IBRD countries)SudanSurinameSwazilandSwedenSwitzerlandSyrian Arab RepublicTajikistanTanzaniaThailandTimor-LesteTogoTongaTrinidad and TobagoTunisiaTurkeyTurkmenistanUgandaUkraineUnited Arab EmiratesUnited KingdomUnited StatesUpper middle incomeUruguayUzbekistanVanuatuVenezuela, RBVietnamWest Bank and GazaWorldYemen, Rep.ZambiaZimbabwe Timeline:
This timeline shows a graph from 1982 to 2016 of Sub-Saharan Africa (excluding high income). No data until 1981. Number of actual observations by date: 35.
Source name:
World Development Indicators
Source organization:
World Bank national accounts data, and OECD National Accounts data files.
Categories, topics:
Economy & Growth
Last updated:
apr 23, 2017
Indicators value changes by year
Minimum:
132.458 bln
jan 1, 1986
Maximum:
1.164 trl
jan 1, 2015
At the date of observation
Value
Absolute change
Change from previous value
jan 1, 1982
164.903 bln
+164.903 bln
0.0%
jan 1, 1983
154.192 bln
-10.712 bln
-6.5%
jan 1, 1984
146.728 bln
-7.463 bln
-4.84%
jan 1, 1985
143.212 bln
-3.516 bln
-2.4%
jan 1, 1986
132.458 bln
-10.754 bln
-7.51%
jan 1, 1987
148.032 bln
+15.574 bln
11.76%
jan 1, 1988
177.462 bln
+29.43 bln
19.88%
jan 1, 1989
185.361 bln
+7.899 bln
4.45%
jan 1, 1990
188.418 bln
+3.056 bln
1.65%
jan 1, 1991
194.843 bln
+6.425 bln
3.41%
jan 1, 1992
199.008 bln
+4.166 bln
2.14%
jan 1, 1993
205.546 bln
+6.538 bln
3.29%
jan 1, 1994
195.378 bln
-10.168 bln
-4.95%
jan 1, 1995
192.328 bln
-3.051 bln
-1.56%
jan 1, 1996
227.286 bln
+34.958 bln
18.18%
jan 1, 1997
235.644 bln
+8.358 bln
3.68%
jan 1, 1998
244.747 bln
+9.103 bln
3.86%
jan 1, 1999
238.296 bln
-6.451 bln
-2.64%
jan 1, 2000
235.314 bln
-2.982 bln
-1.25%
jan 1, 2001
237.845 bln
+2.531 bln
1.08%
jan 1, 2002
233.046 bln
-4.799 bln
-2.02%
jan 1, 2003
253.09 bln
+20.044 bln
8.6%
jan 1, 2004
319.159 bln
+66.069 bln
26.1%
jan 1, 2005
390.266 bln
+71.107 bln
22.28%
jan 1, 2006
454.097 bln
+63.832 bln
16.36%
jan 1, 2007
503.542 bln
+49.445 bln
10.89%
jan 1, 2008
609.59 bln
+106.048 bln
21.06%
jan 1, 2009
663.689 bln
+54.099 bln
8.87%
jan 1, 2010
683.072 bln
+19.383 bln
2.92%
jan 1, 2011
868.731 bln
+185.658 bln
27.18%
jan 1, 2012
959.919 bln
+91.188 bln
10.5%
jan 1, 2013
990.552 bln
+30.633 bln
3.19%
jan 1, 2014
1.133 trl
+142.413 bln
14.38%
jan 1, 2015
1.164 trl
+30.626 bln
2.7%
jan 1, 2016
1.133 trl
-31.02 bln
-2.67%
Ranking of countries by current statistics by years


Comments: