29
/
en
AIzaSyAYiBZKx7MnpbEhh9jyipgxe19OcubqV5w
April 1, 2024
79547
Barbados
BRB
true
2
1
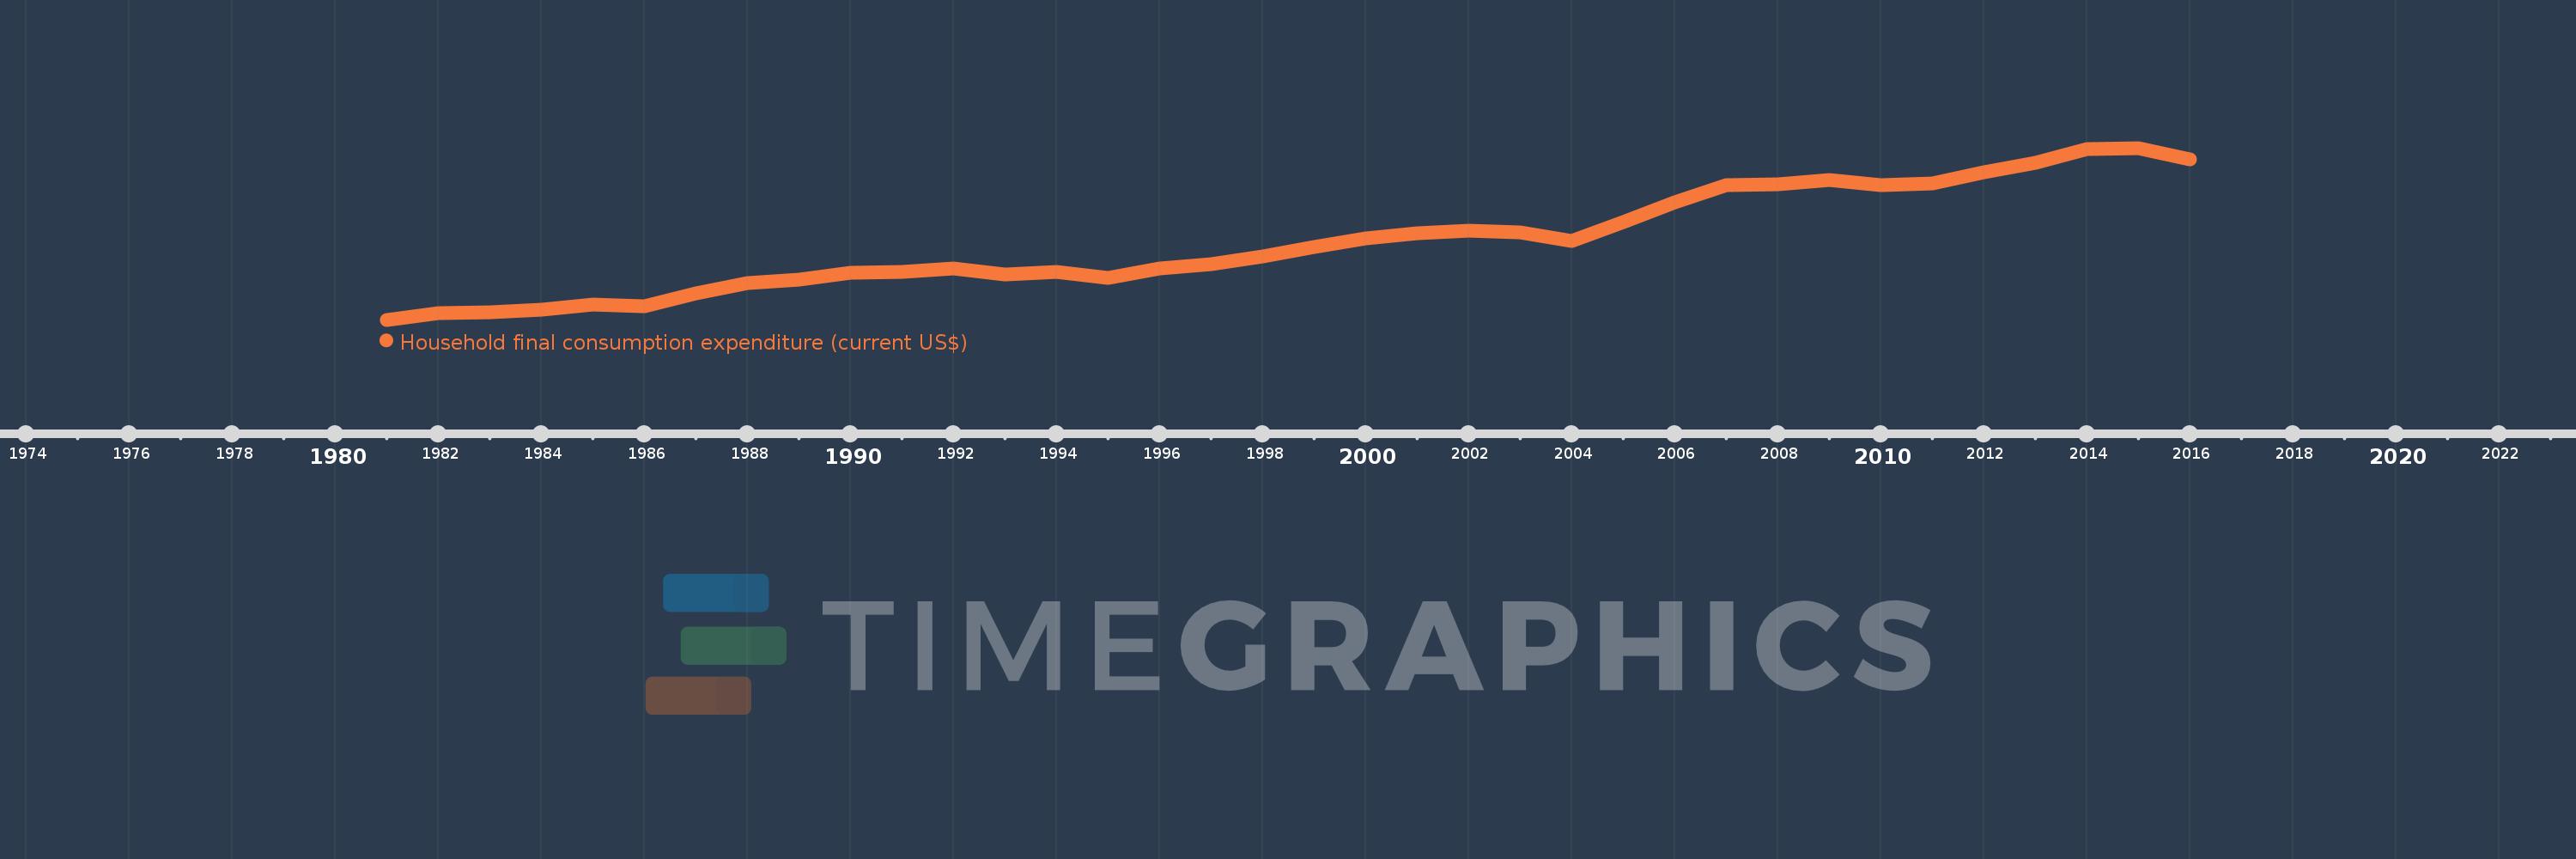
Household final consumption expenditure (current US$)
2016,2015,2014,2013,2012,2011,2010,2009,2008,2007,2006,2005,2004,2003,2002,2001,2000,1999,1998,1997,1996,1995,1994,1993,1992,1991,1990,1989,1988,1987,1986,1985,1984,1983,1982,1981
This statistics in other country:
AfghanistanAlbaniaAlgeriaAngolaAntigua and BarbudaArab WorldArgentinaArmeniaArubaAustraliaAustriaAzerbaijanBahamas, TheBahrainBangladeshBarbadosBelarusBelgiumBelizeBeninBermudaBhutanBoliviaBosnia and HerzegovinaBotswanaBrazilBrunei DarussalamBulgariaBurkina FasoBurundiCabo VerdeCambodiaCameroonCanadaCaribbean small statesCentral African RepublicCentral Europe and the BalticsChadChileChinaColombiaComorosCongo, Dem. Rep.Congo, Rep.Costa RicaCote d'IvoireCroatiaCubaCyprusCzech RepublicDenmarkDjiboutiDominicaDominican RepublicEarly-demographic dividendEast Asia & PacificEast Asia & Pacific (excluding high income)East Asia & Pacific (IDA & IBRD countries)EcuadorEgypt, Arab Rep.El SalvadorEquatorial GuineaEritreaEstoniaEthiopiaEuro areaEurope & Central AsiaEurope & Central Asia (excluding high income)Europe & Central Asia (IDA & IBRD countries)European UnionFaroe IslandsFijiFinlandFranceGabonGambia, TheGeorgiaGermanyGhanaGreeceGrenadaGuatemalaGuineaGuinea-BissauGuyanaHaitiHeavily indebted poor countries (HIPC)High incomeHondurasHong Kong SAR, ChinaHungaryIBRD onlyIcelandIDA & IBRD totalIDA blendIDA onlyIDA totalIndiaIndonesiaIran, Islamic Rep.IrelandIsraelItalyJamaicaJapanJordanKazakhstanKenyaKiribatiKorea, Rep.KosovoKuwaitKyrgyz RepublicLao PDRLate-demographic dividendLatin America & Caribbean Latin America & Caribbean (excluding high income)Latin America & the Caribbean (IDA & IBRD countries)LatviaLeast developed countries: UN classificationLebanonLesothoLiberiaLibyaLithuaniaLow & middle incomeLow incomeLower middle incomeLuxembourgMacao SAR, ChinaMacedonia, FYRMadagascarMalawiMalaysiaMaliMaltaMauritaniaMauritiusMexicoMicronesia, Fed. Sts.Middle East & North AfricaMiddle East & North Africa (excluding high income)Middle East & North Africa (IDA & IBRD countries)Middle incomeMoldovaMongoliaMontenegroMoroccoMozambiqueNamibiaNepalNetherlandsNew CaledoniaNew ZealandNicaraguaNigerNigeriaNorth AmericaNorwayOECD membersOmanOther small statesPakistanPanamaPapua New GuineaParaguayPeruPhilippinesPolandPortugalPost-demographic dividendPre-demographic dividendPuerto RicoQatarRomaniaRussian FederationRwandaSaudi ArabiaSenegalSerbiaSeychellesSierra LeoneSingaporeSlovak RepublicSloveniaSmall statesSolomon IslandsSomaliaSouth AfricaSouth AsiaSouth Asia (IDA & IBRD)South SudanSpainSri LankaSt. Kitts and NevisSt. LuciaSt. Vincent and the GrenadinesSub-Saharan Africa Sub-Saharan Africa (excluding high income)Sub-Saharan Africa (IDA & IBRD countries)SudanSurinameSwazilandSwedenSwitzerlandSyrian Arab RepublicTajikistanTanzaniaThailandTimor-LesteTogoTongaTrinidad and TobagoTunisiaTurkeyTurkmenistanUgandaUkraineUnited Arab EmiratesUnited KingdomUnited StatesUpper middle incomeUruguayUzbekistanVanuatuVenezuela, RBVietnamWest Bank and GazaWorldYemen, Rep.ZambiaZimbabwe Timeline:
This timeline shows a graph from 1981 to 2016 of Barbados. No data until 1980. Number of actual observations by date: 36.
Source name:
World Development Indicators
Source organization:
World Bank national accounts data, and OECD National Accounts data files.
Categories, topics:
Economy & Growth
Last updated:
apr 23, 2017
Indicators value changes by year
Minimum:
802.676 mln
jan 1, 1981
Maximum:
3.738 bln
jan 1, 2015
At the date of observation
Value
Absolute change
Change from previous value
jan 1, 1981
802.676 mln
+802.676 mln
0.0%
jan 1, 1982
917.153 mln
+114.477 mln
14.26%
jan 1, 1983
937.643 mln
+20.49 mln
2.23%
jan 1, 1984
980.85 mln
+43.207 mln
4.61%
jan 1, 1985
1.063 bln
+82.183 mln
8.38%
jan 1, 1986
1.037 bln
-26.132 mln
-2.46%
jan 1, 1987
1.256 bln
+219.452 mln
21.16%
jan 1, 1988
1.436 bln
+179.437 mln
14.28%
jan 1, 1989
1.488 bln
+51.968 mln
3.62%
jan 1, 1990
1.602 bln
+114.254 mln
7.68%
jan 1, 1991
1.625 bln
+22.717 mln
1.42%
jan 1, 1992
1.679 bln
+54.714 mln
3.37%
jan 1, 1993
1.581 bln
-98.916 mln
-5.89%
jan 1, 1994
1.616 bln
+35.664 mln
2.26%
jan 1, 1995
1.515 bln
-101.3 mln
-6.27%
jan 1, 1996
1.68 bln
+165.266 mln
10.91%
jan 1, 1997
1.746 bln
+65.48 mln
3.9%
jan 1, 1998
1.889 bln
+142.992 mln
8.19%
jan 1, 1999
2.048 bln
+159.499 mln
8.45%
jan 1, 2000
2.193 bln
+144.583 mln
7.06%
jan 1, 2001
2.277 bln
+84.239 mln
3.84%
jan 1, 2002
2.329 bln
+51.7 mln
2.27%
jan 1, 2003
2.3 bln
-29.0 mln
-1.25%
jan 1, 2004
2.147 bln
-152.15 mln
-6.62%
jan 1, 2005
2.471 bln
+323.15 mln
15.05%
jan 1, 2006
2.808 bln
+337.85 mln
13.67%
jan 1, 2007
3.104 bln
+295.6 mln
10.53%
jan 1, 2008
3.118 bln
+13.7 mln
0.44%
jan 1, 2009
3.19 bln
+71.95 mln
2.31%
jan 1, 2010
3.104 bln
-86.193 mln
-2.7%
jan 1, 2011
3.128 bln
+24.925 mln
0.8%
jan 1, 2012
3.327 bln
+198.987 mln
6.36%
jan 1, 2013
3.481 bln
+153.617 mln
4.62%
jan 1, 2014
3.726 bln
+244.561 mln
7.03%
jan 1, 2015
3.738 bln
+12.002 mln
0.32%
jan 1, 2016
3.536 bln
-201.407 mln
-5.39%
Ranking of countries by current statistics by years


Comments: