29
/
en
AIzaSyAYiBZKx7MnpbEhh9jyipgxe19OcubqV5w
April 1, 2024
80842
Belarus
BLR
true
2
1
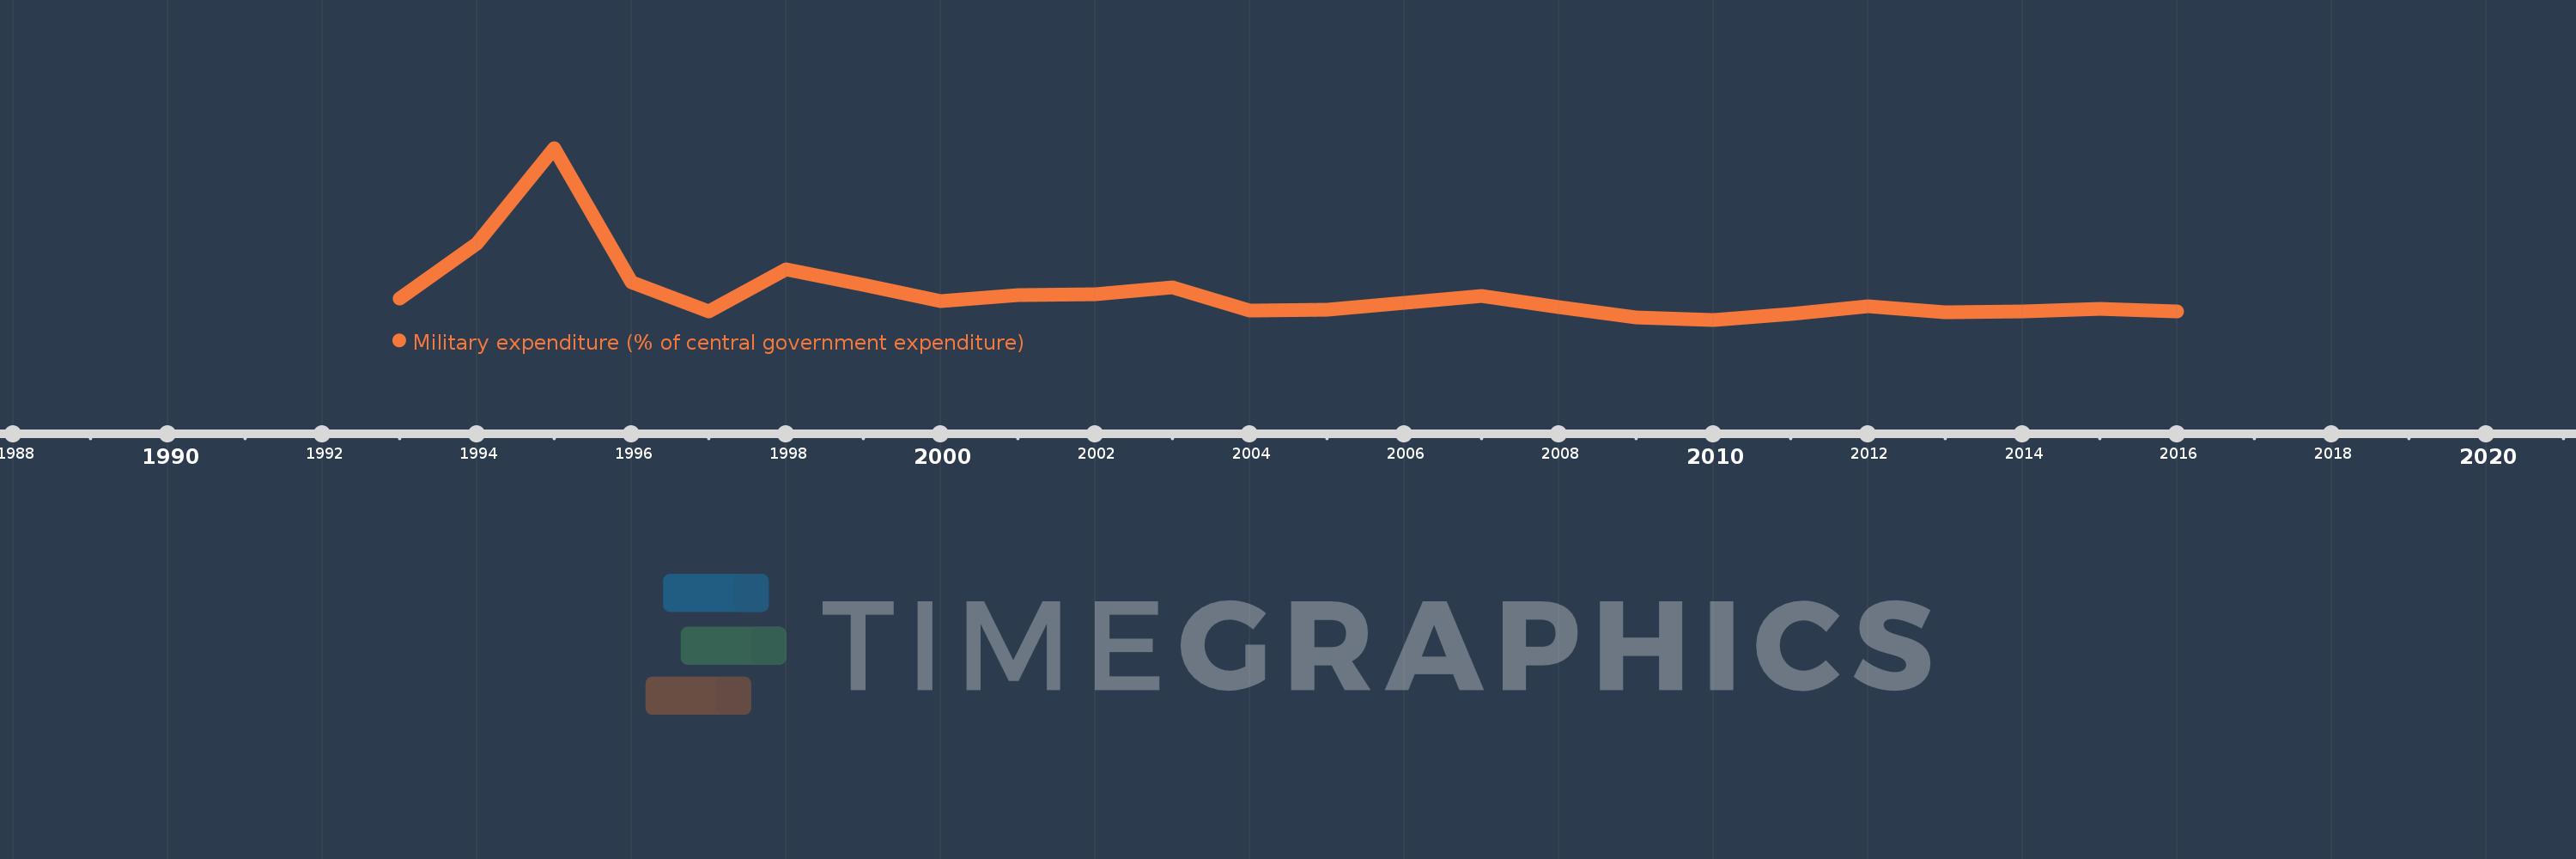
Military expenditure (% of central government expenditure)
2016,2015,2014,2013,2012,2011,2010,2009,2008,2007,2006,2005,2004,2003,2002,2001,2000,1999,1998,1997,1996,1995,1994,1993
This statistics in other country:
Timeline:
This timeline shows a graph from 1993 to 2016 of Belarus. No data until 1992. Number of actual observations by date: 24.
Source name:
World Development Indicators
Source organization:
Stockholm International Peace Research Institute (SIPRI), Yearbook: Armaments, Disarmament and International Security.
Categories, topics:
Public Sector
Last updated:
apr 23, 2017
Indicators value changes by year
Maximum:
12.096
jan 1, 1995
At the date of observation
Value
Absolute change
Change from previous value
jan 1, 1993
5.155
+5.155
0.0%
jan 1, 1994
7.677
+2.523
48.94%
jan 1, 1995
12.096
+4.419
57.56%
jan 1, 1996
5.913
-6.183
-51.12%
jan 1, 1997
4.547
-1.365
-23.09%
jan 1, 1998
6.5
+1.953
42.94%
jan 1, 1999
5.772
-0.728
-11.21%
jan 1, 2000
5.051
-0.721
-12.48%
jan 1, 2001
5.316
+0.265
5.24%
jan 1, 2002
5.353
+0.037
0.69%
jan 1, 2003
5.674
+0.321
6.0%
jan 1, 2004
4.605
-1.069
-18.85%
jan 1, 2005
4.64
+0.036
0.78%
jan 1, 2006
4.953
+0.313
6.75%
jan 1, 2007
5.274
+0.32
6.47%
jan 1, 2008
4.76
-0.514
-9.74%
jan 1, 2009
4.281
-0.479
-10.06%
jan 1, 2010
4.178
-0.103
-2.4%
jan 1, 2011
4.441
+0.262
6.27%
jan 1, 2012
4.812
+0.371
8.35%
jan 1, 2013
4.503
-0.308
-6.41%
jan 1, 2014
4.551
+0.047
1.05%
jan 1, 2015
4.679
+0.128
2.82%
jan 1, 2016
4.56
-0.119
-2.55%
Ranking of countries by current statistics by years


Comments: