29
/
en
AIzaSyAYiBZKx7MnpbEhh9jyipgxe19OcubqV5w
April 1, 2024
122438
Dominican Republic
DOM
true
2
1
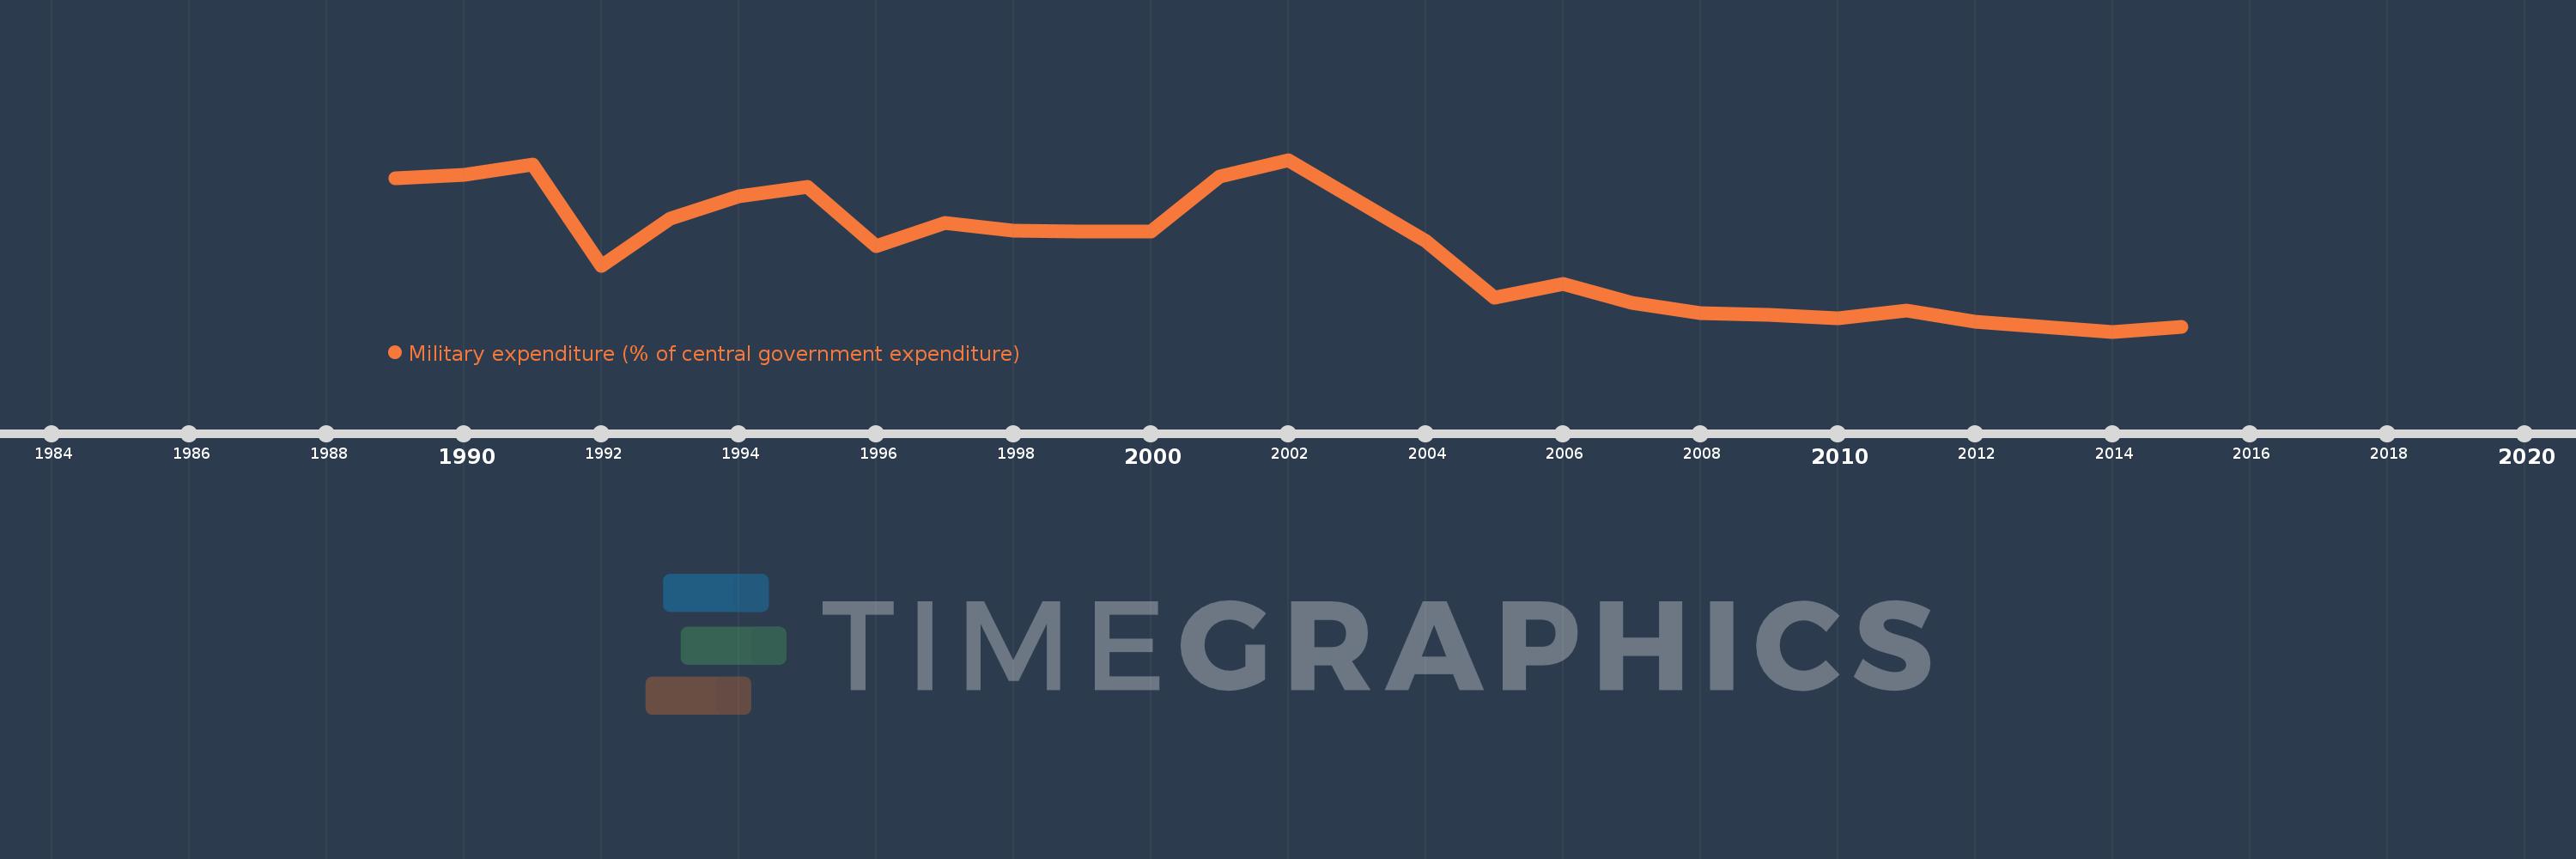
Military expenditure (% of central government expenditure)
2015,2014,2013,2012,2011,2010,2009,2008,2007,2006,2005,2004,2003,2002,2001,2000,1999,1998,1997,1996,1995,1994,1993,1992,1991,1990,1989
This statistics in other country:
Timeline:
This timeline shows a graph from 1989 to 2015 of Dominican Republic. No data until 1988. Number of actual observations by date: 27.
Source name:
World Development Indicators
Source organization:
Stockholm International Peace Research Institute (SIPRI), Yearbook: Armaments, Disarmament and International Security.
Categories, topics:
Public Sector
Last updated:
apr 23, 2017
Indicators value changes by year
At the date of observation
Value
Absolute change
Change from previous value
jan 1, 1989
9.311
+9.311
0.0%
jan 1, 1990
9.431
+0.119
1.28%
jan 1, 1991
9.799
+0.368
3.9%
jan 1, 1992
6.262
-3.537
-36.1%
jan 1, 1993
7.921
+1.659
26.5%
jan 1, 1994
8.698
+0.778
9.82%
jan 1, 1995
9.014
+0.316
3.63%
jan 1, 1996
6.949
-2.065
-22.91%
jan 1, 1997
7.752
+0.803
11.55%
jan 1, 1998
7.487
-0.265
-3.41%
jan 1, 1999
7.474
-0.013
-0.17%
jan 1, 2000
7.449
-0.025
-0.33%
jan 1, 2001
9.375
+1.926
25.85%
jan 1, 2002
9.971
+0.596
6.36%
jan 1, 2003
8.533
-1.439
-14.43%
jan 1, 2004
7.133
-1.399
-16.4%
jan 1, 2005
5.158
-1.976
-27.7%
jan 1, 2006
5.638
+0.48
9.32%
jan 1, 2007
4.967
-0.671
-11.91%
jan 1, 2008
4.62
-0.347
-6.99%
jan 1, 2009
4.546
-0.074
-1.6%
jan 1, 2010
4.422
-0.124
-2.72%
jan 1, 2011
4.698
+0.276
6.25%
jan 1, 2012
4.302
-0.396
-8.44%
jan 1, 2013
4.125
-0.177
-4.11%
jan 1, 2014
3.959
-0.166
-4.01%
jan 1, 2015
4.123
+0.164
4.13%
Ranking of countries by current statistics by years


Comments: