29
/
en
AIzaSyAYiBZKx7MnpbEhh9jyipgxe19OcubqV5w
April 1, 2024
50234
Middle East & North Africa (IDA & IBRD countries)
TMN
false
2
1
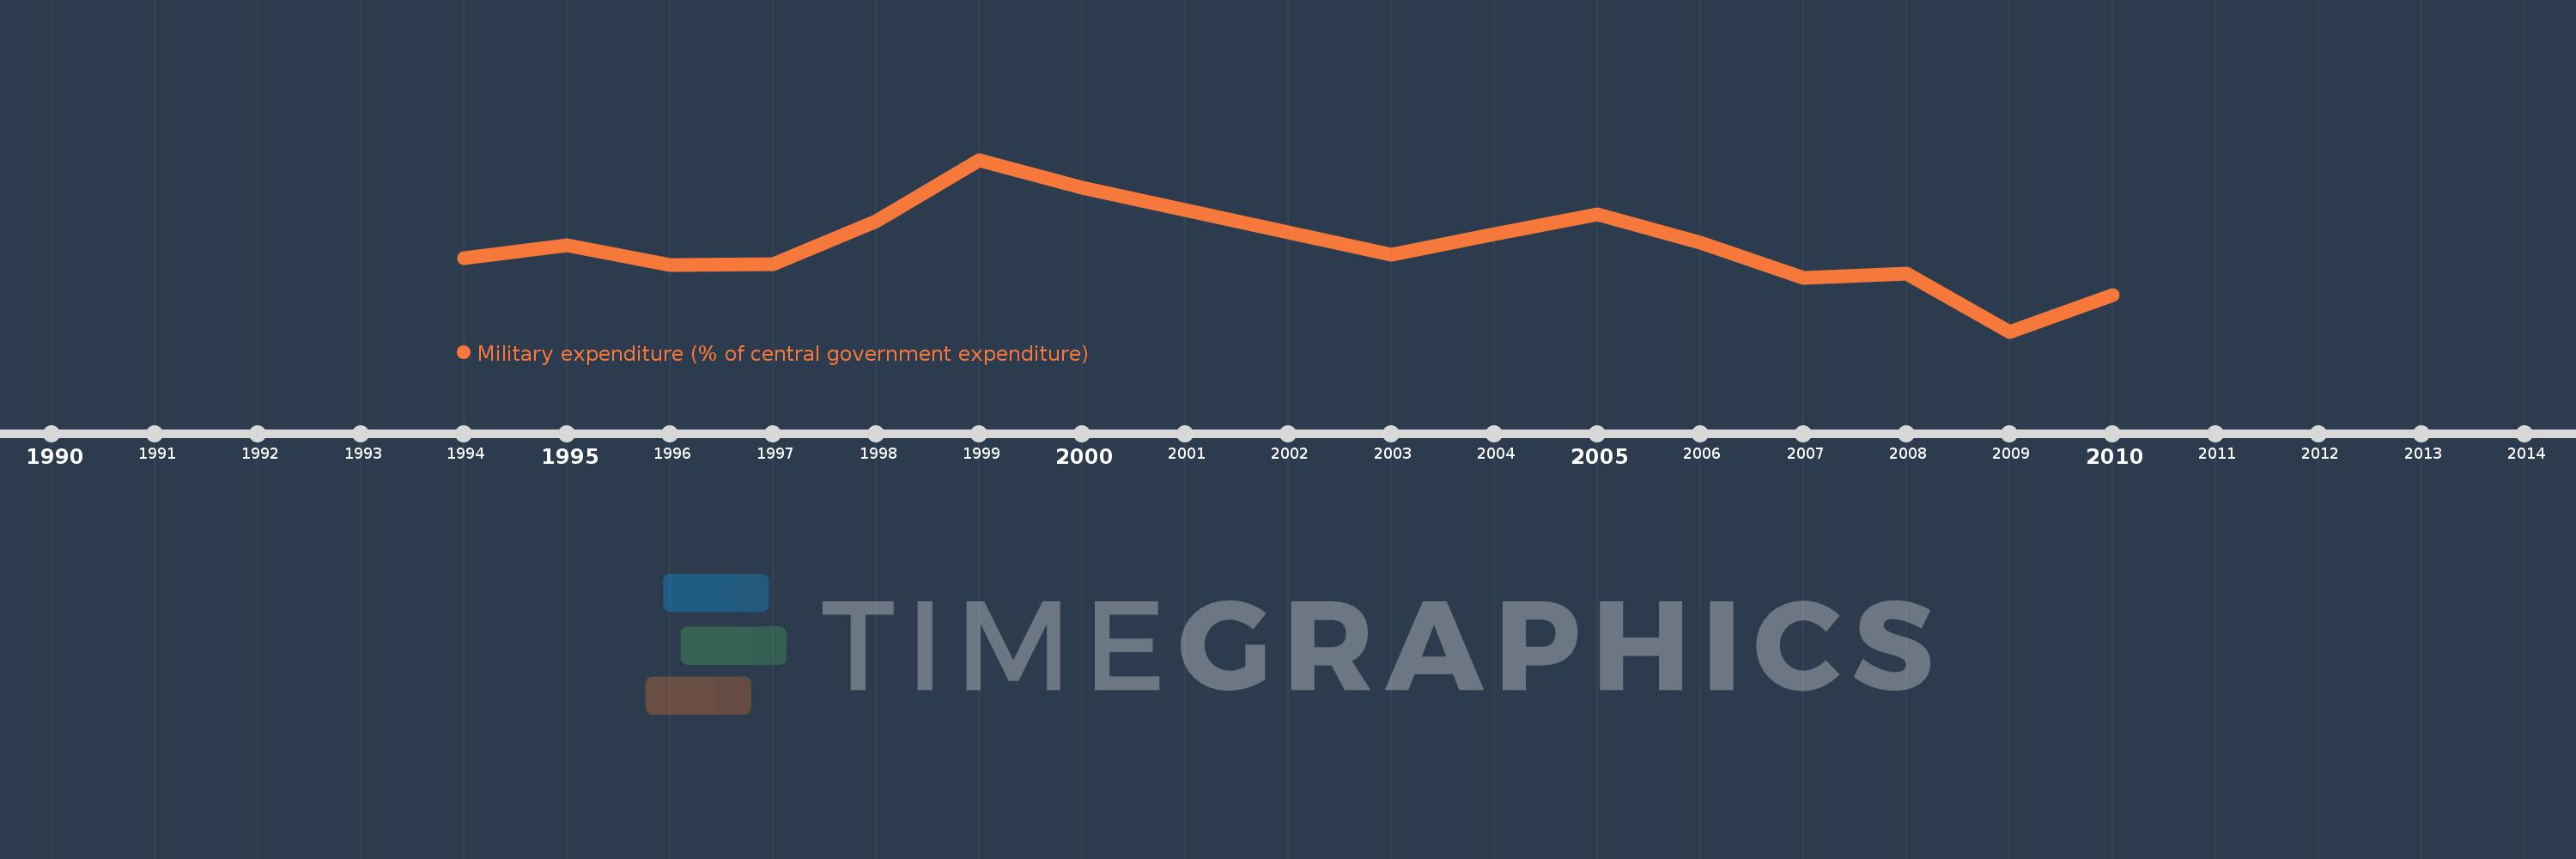
Military expenditure (% of central government expenditure)
2010,2009,2008,2007,2006,2005,2004,2003,2000,1999,1998,1997,1996,1995,1994
This statistics in other country:
Timeline:
This timeline shows a graph from 1994 to 2010 of Middle East & North Africa (IDA & IBRD countries). No data until 1993. Number of actual observations by date: 15.
Source name:
World Development Indicators
Source organization:
Stockholm International Peace Research Institute (SIPRI), Yearbook: Armaments, Disarmament and International Security.
Categories, topics:
Public Sector
Last updated:
apr 23, 2017
Indicators value changes by year
Minimum:
12.266
jan 1, 2009
Maximum:
15.962
jan 1, 1999
At the date of observation
Value
Absolute change
Change from previous value
jan 1, 1994
13.849
+13.849
0.0%
jan 1, 1995
14.13
+0.281
2.03%
jan 1, 1996
13.696
-0.434
-3.07%
jan 1, 1997
13.725
+0.028
0.21%
jan 1, 1998
14.635
+0.91
6.63%
jan 1, 1999
15.962
+1.327
9.07%
jan 1, 2000
15.369
-0.593
-3.71%
jan 1, 2003
13.923
-1.446
-9.41%
jan 1, 2004
14.368
+0.445
3.19%
jan 1, 2005
14.78
+0.412
2.87%
jan 1, 2006
14.176
-0.604
-4.09%
jan 1, 2007
13.422
-0.754
-5.32%
jan 1, 2008
13.506
+0.085
0.63%
jan 1, 2009
12.266
-1.24
-9.18%
jan 1, 2010
13.054
+0.788
6.42%
Ranking of countries by current statistics by years


Comments: