29
/
en
AIzaSyAYiBZKx7MnpbEhh9jyipgxe19OcubqV5w
April 1, 2024
185484
Madagascar
MDG
true
2
1
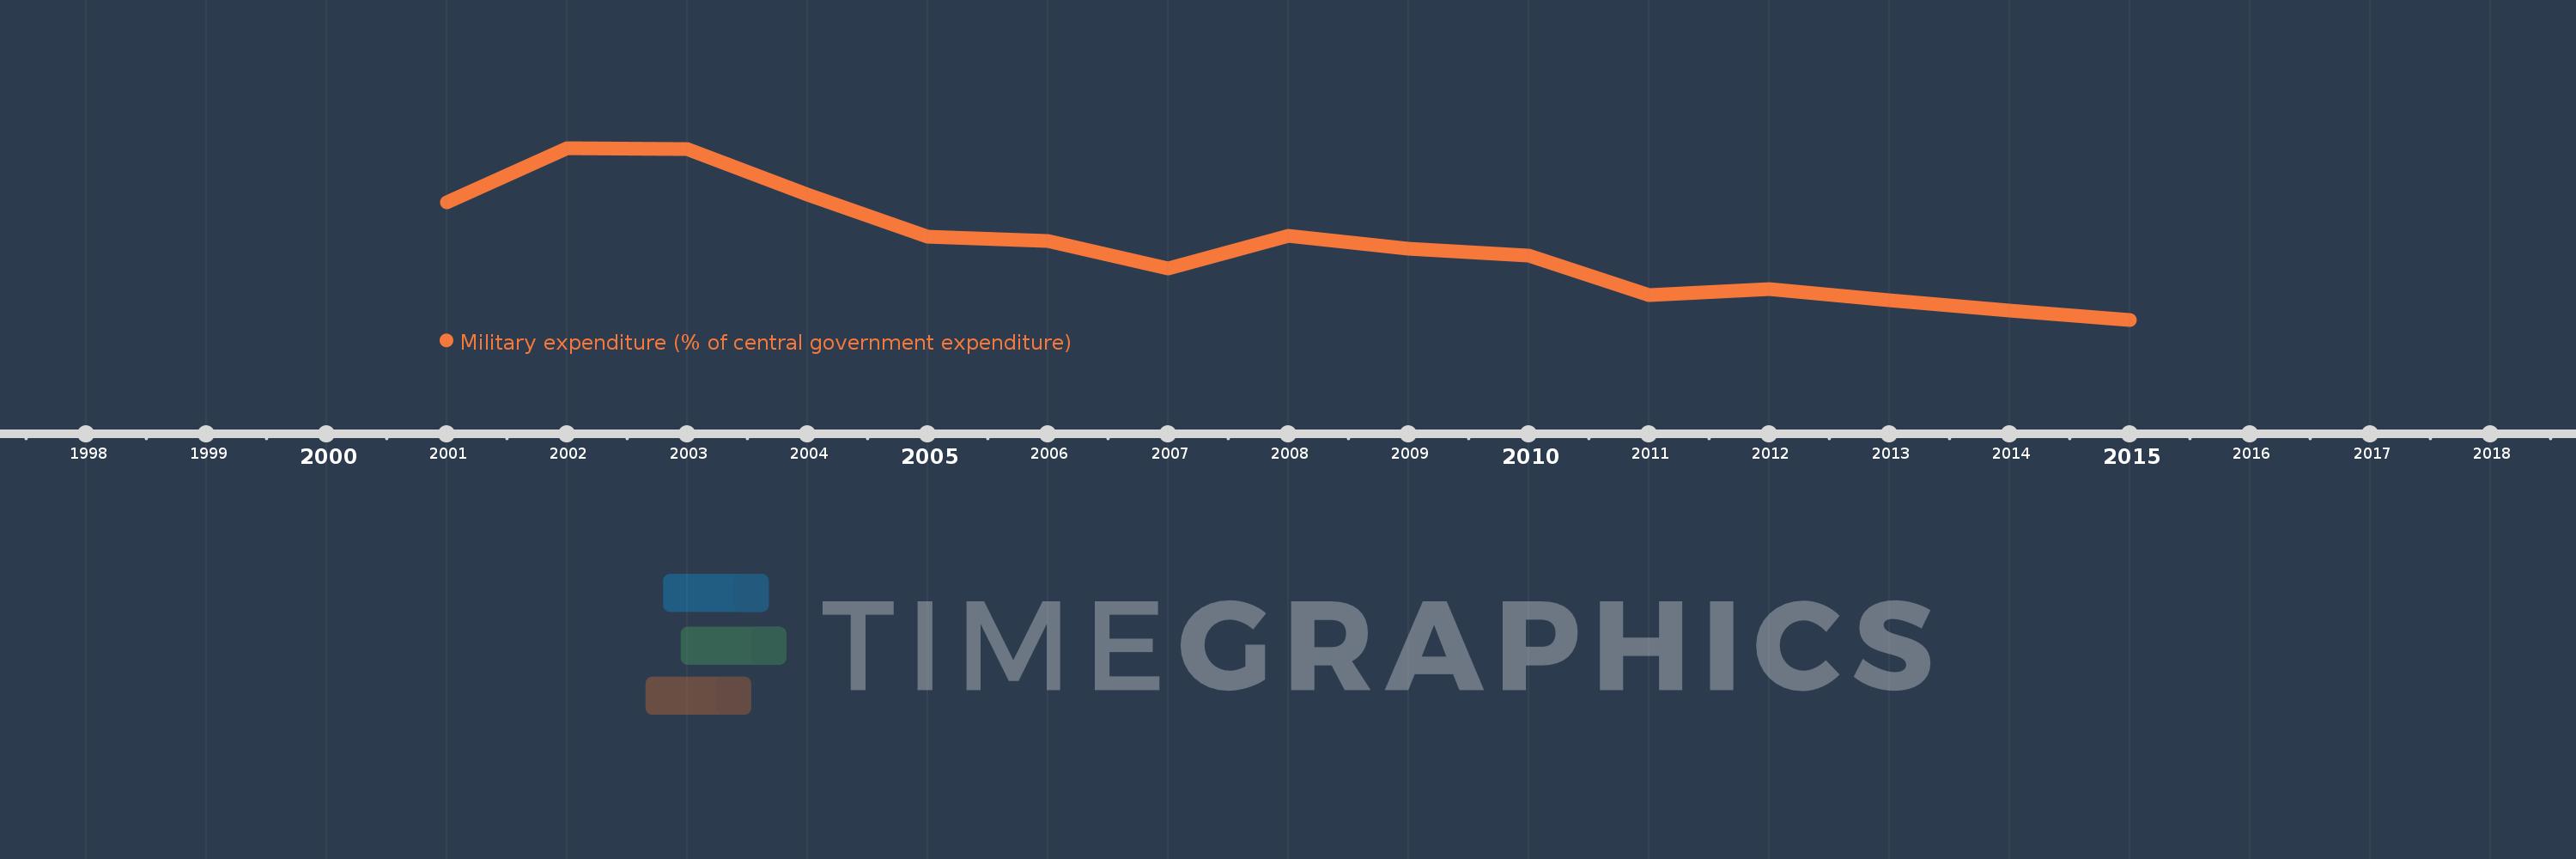
Military expenditure (% of central government expenditure)
2015,2014,2013,2012,2011,2010,2009,2008,2007,2006,2005,2004,2003,2002,2001
This statistics in other country:
Timeline:
This timeline shows a graph from 2001 to 2015 of Madagascar. No data until 2000. Number of actual observations by date: 15.
Source name:
World Development Indicators
Source organization:
Stockholm International Peace Research Institute (SIPRI), Yearbook: Armaments, Disarmament and International Security.
Categories, topics:
Public Sector
Last updated:
apr 23, 2017
Indicators value changes by year
Maximum:
13.949
jan 1, 2002
At the date of observation
Value
Absolute change
Change from previous value
jan 1, 2001
11.464
+11.464
0.0%
jan 1, 2002
13.949
+2.485
21.68%
jan 1, 2003
13.901
-0.049
-0.35%
jan 1, 2004
11.804
-2.096
-15.08%
jan 1, 2005
9.907
-1.898
-16.07%
jan 1, 2006
9.707
-0.2
-2.02%
jan 1, 2007
8.428
-1.278
-13.17%
jan 1, 2008
9.931
+1.503
17.83%
jan 1, 2009
9.33
-0.601
-6.05%
jan 1, 2010
9.021
-0.309
-3.32%
jan 1, 2011
7.212
-1.809
-20.06%
jan 1, 2012
7.501
+0.29
4.01%
jan 1, 2013
6.981
-0.52
-6.93%
jan 1, 2014
6.518
-0.463
-6.63%
jan 1, 2015
6.102
-0.417
-6.39%
Ranking of countries by current statistics by years


Comments: