29
/
en
AIzaSyAYiBZKx7MnpbEhh9jyipgxe19OcubqV5w
April 1, 2024
105162
Chile
CHL
true
2
1
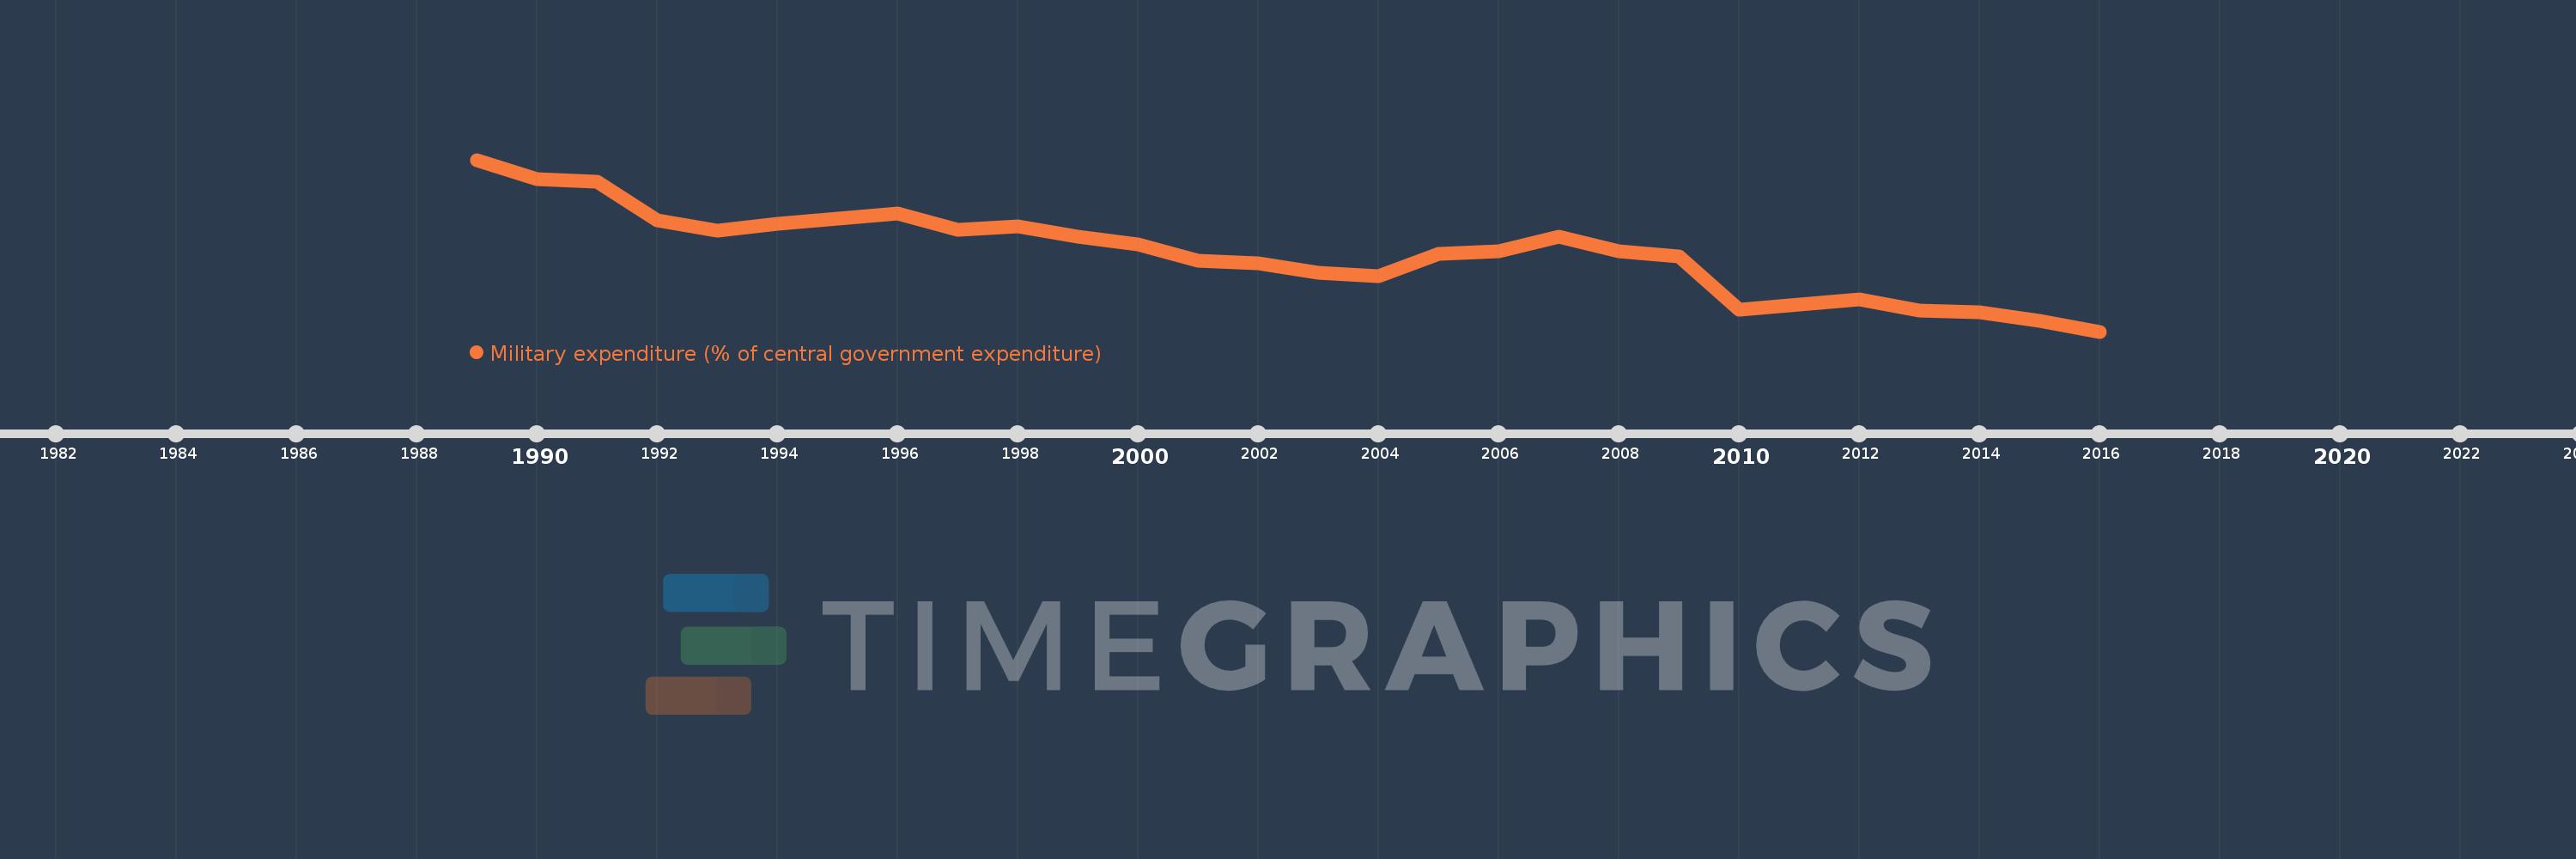
Military expenditure (% of central government expenditure)
2016,2015,2014,2013,2012,2011,2010,2009,2008,2007,2006,2005,2004,2003,2002,2001,2000,1999,1998,1997,1996,1995,1994,1993,1992,1991,1990,1989
This statistics in other country:
Timeline:
This timeline shows a graph from 1989 to 2016 of Chile. No data until 1988. Number of actual observations by date: 28.
Source name:
World Development Indicators
Source organization:
Stockholm International Peace Research Institute (SIPRI), Yearbook: Armaments, Disarmament and International Security.
Categories, topics:
Public Sector
Last updated:
apr 23, 2017
Indicators value changes by year
Maximum:
19.948
jan 1, 1989
At the date of observation
Value
Absolute change
Change from previous value
jan 1, 1989
19.948
+19.948
0.0%
jan 1, 1990
18.686
-1.262
-6.33%
jan 1, 1991
18.519
-0.167
-0.89%
jan 1, 1992
16.018
-2.501
-13.5%
jan 1, 1993
15.325
-0.693
-4.33%
jan 1, 1994
15.778
+0.453
2.96%
jan 1, 1995
16.091
+0.313
1.98%
jan 1, 1996
16.456
+0.365
2.27%
jan 1, 1997
15.397
-1.059
-6.44%
jan 1, 1998
15.592
+0.195
1.26%
jan 1, 1999
14.955
-0.637
-4.08%
jan 1, 2000
14.442
-0.513
-3.43%
jan 1, 2001
13.351
-1.092
-7.56%
jan 1, 2002
13.198
-0.153
-1.15%
jan 1, 2003
12.599
-0.598
-4.53%
jan 1, 2004
12.358
-0.242
-1.92%
jan 1, 2005
13.814
+1.456
11.78%
jan 1, 2006
13.985
+0.171
1.24%
jan 1, 2007
14.952
+0.967
6.92%
jan 1, 2008
13.974
-0.978
-6.54%
jan 1, 2009
13.633
-0.34
-2.44%
jan 1, 2010
10.188
-3.445
-25.27%
jan 1, 2011
10.505
+0.317
3.11%
jan 1, 2012
10.83
+0.325
3.09%
jan 1, 2013
10.117
-0.713
-6.58%
jan 1, 2014
10.004
-0.112
-1.11%
jan 1, 2015
9.414
-0.59
-5.9%
jan 1, 2016
8.737
-0.678
-7.2%
Ranking of countries by current statistics by years


Comments: