29
/
en
AIzaSyAYiBZKx7MnpbEhh9jyipgxe19OcubqV5w
April 1, 2024
287503
Zimbabwe
ZWE
true
2
1
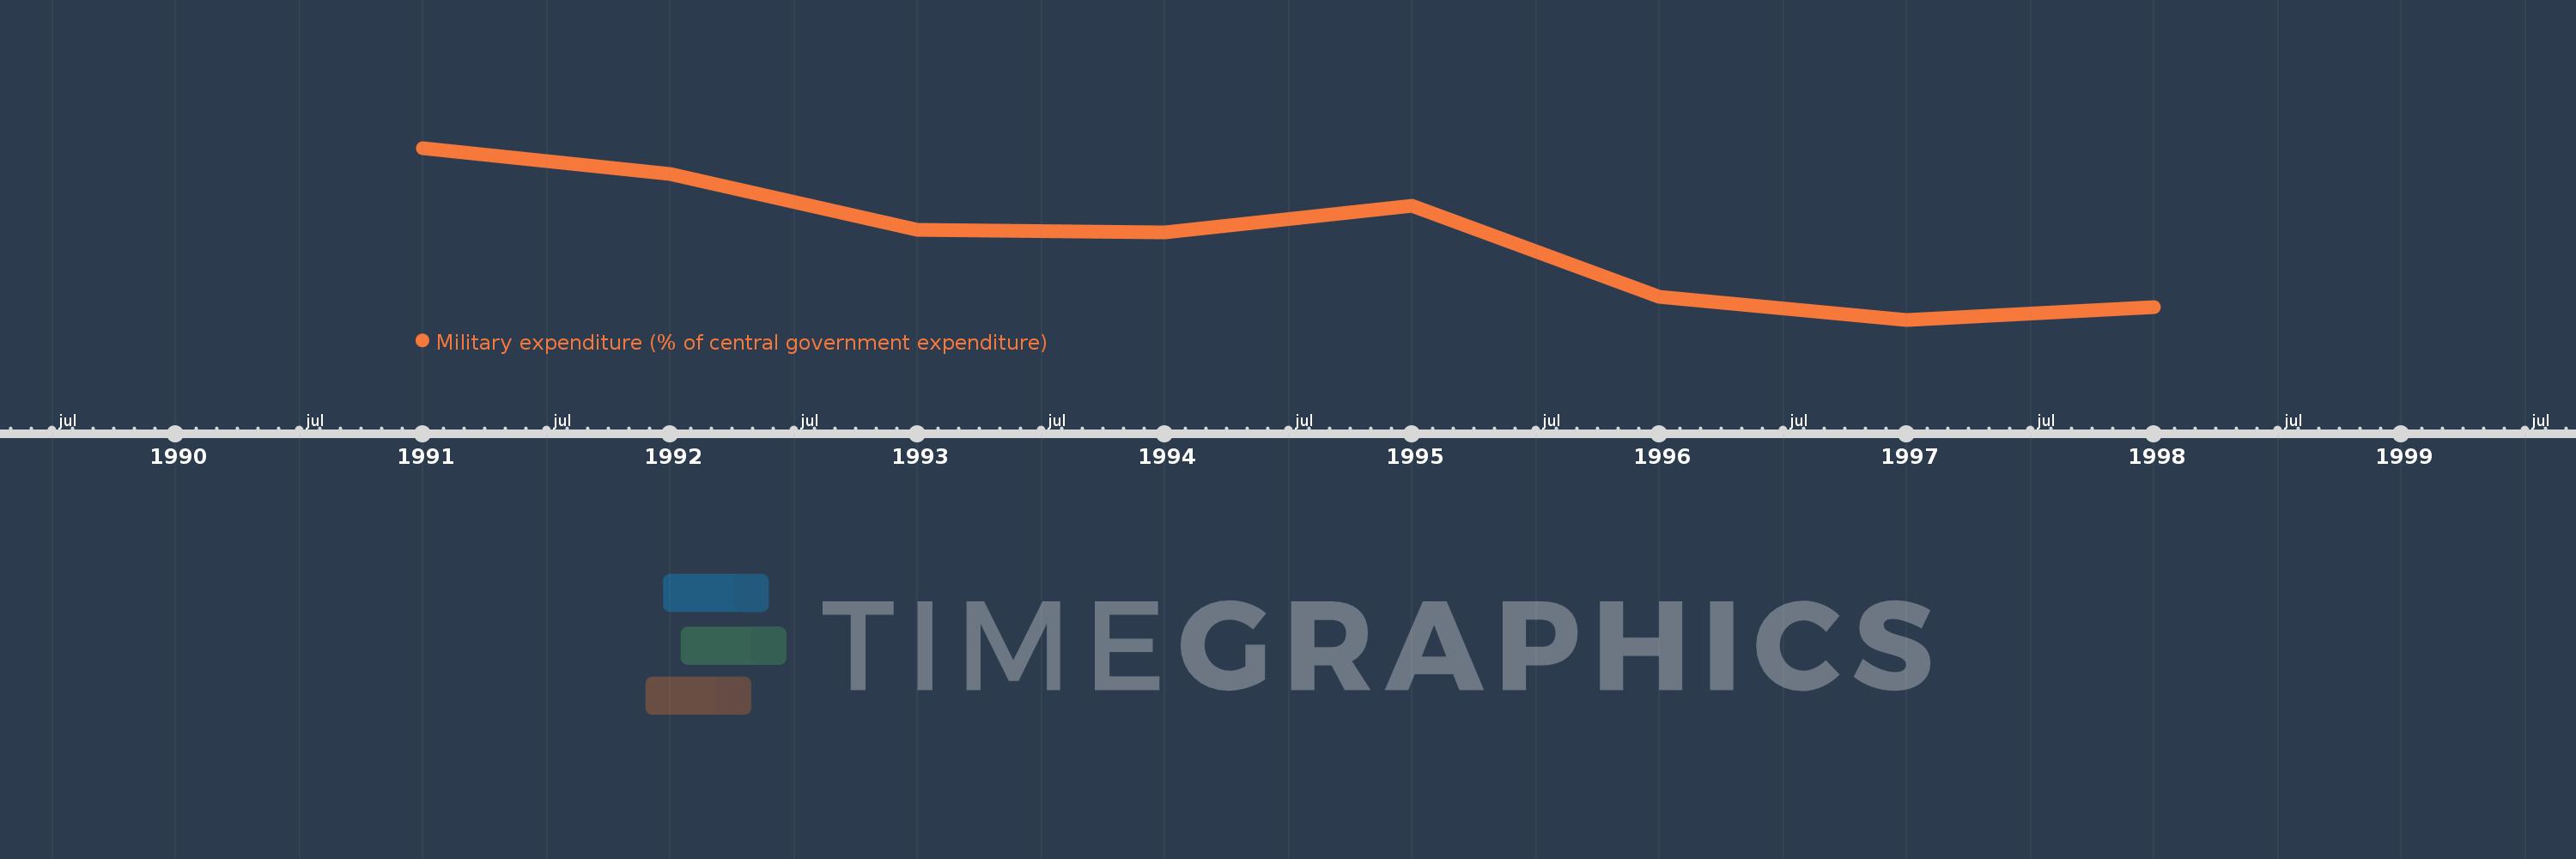
Military expenditure (% of central government expenditure)
1998,1997,1996,1995,1994,1993,1992,1991
This statistics in other country:
Timeline:
This timeline shows a graph from 1991 to 1998 of Zimbabwe. No data until 1990. Number of actual observations by date: 8.
Source name:
World Development Indicators
Source organization:
Stockholm International Peace Research Institute (SIPRI), Yearbook: Armaments, Disarmament and International Security.
Categories, topics:
Public Sector
Last updated:
apr 23, 2017
Indicators value changes by year
Minimum:
10.326
jan 1, 1997
Maximum:
19.325
jan 1, 1991
At the date of observation
Value
Absolute change
Change from previous value
jan 1, 1991
19.325
+19.325
0.0%
jan 1, 1992
17.962
-1.363
-7.05%
jan 1, 1993
15.025
-2.937
-16.35%
jan 1, 1994
14.888
-0.137
-0.91%
jan 1, 1995
16.281
+1.394
9.36%
jan 1, 1996
11.515
-4.766
-29.27%
jan 1, 1997
10.326
-1.19
-10.33%
jan 1, 1998
10.988
+0.662
6.41%
Ranking of countries by current statistics by years


Comments: