29
/
en
AIzaSyAYiBZKx7MnpbEhh9jyipgxe19OcubqV5w
April 1, 2024
138332
Georgia
GEO
true
2
1
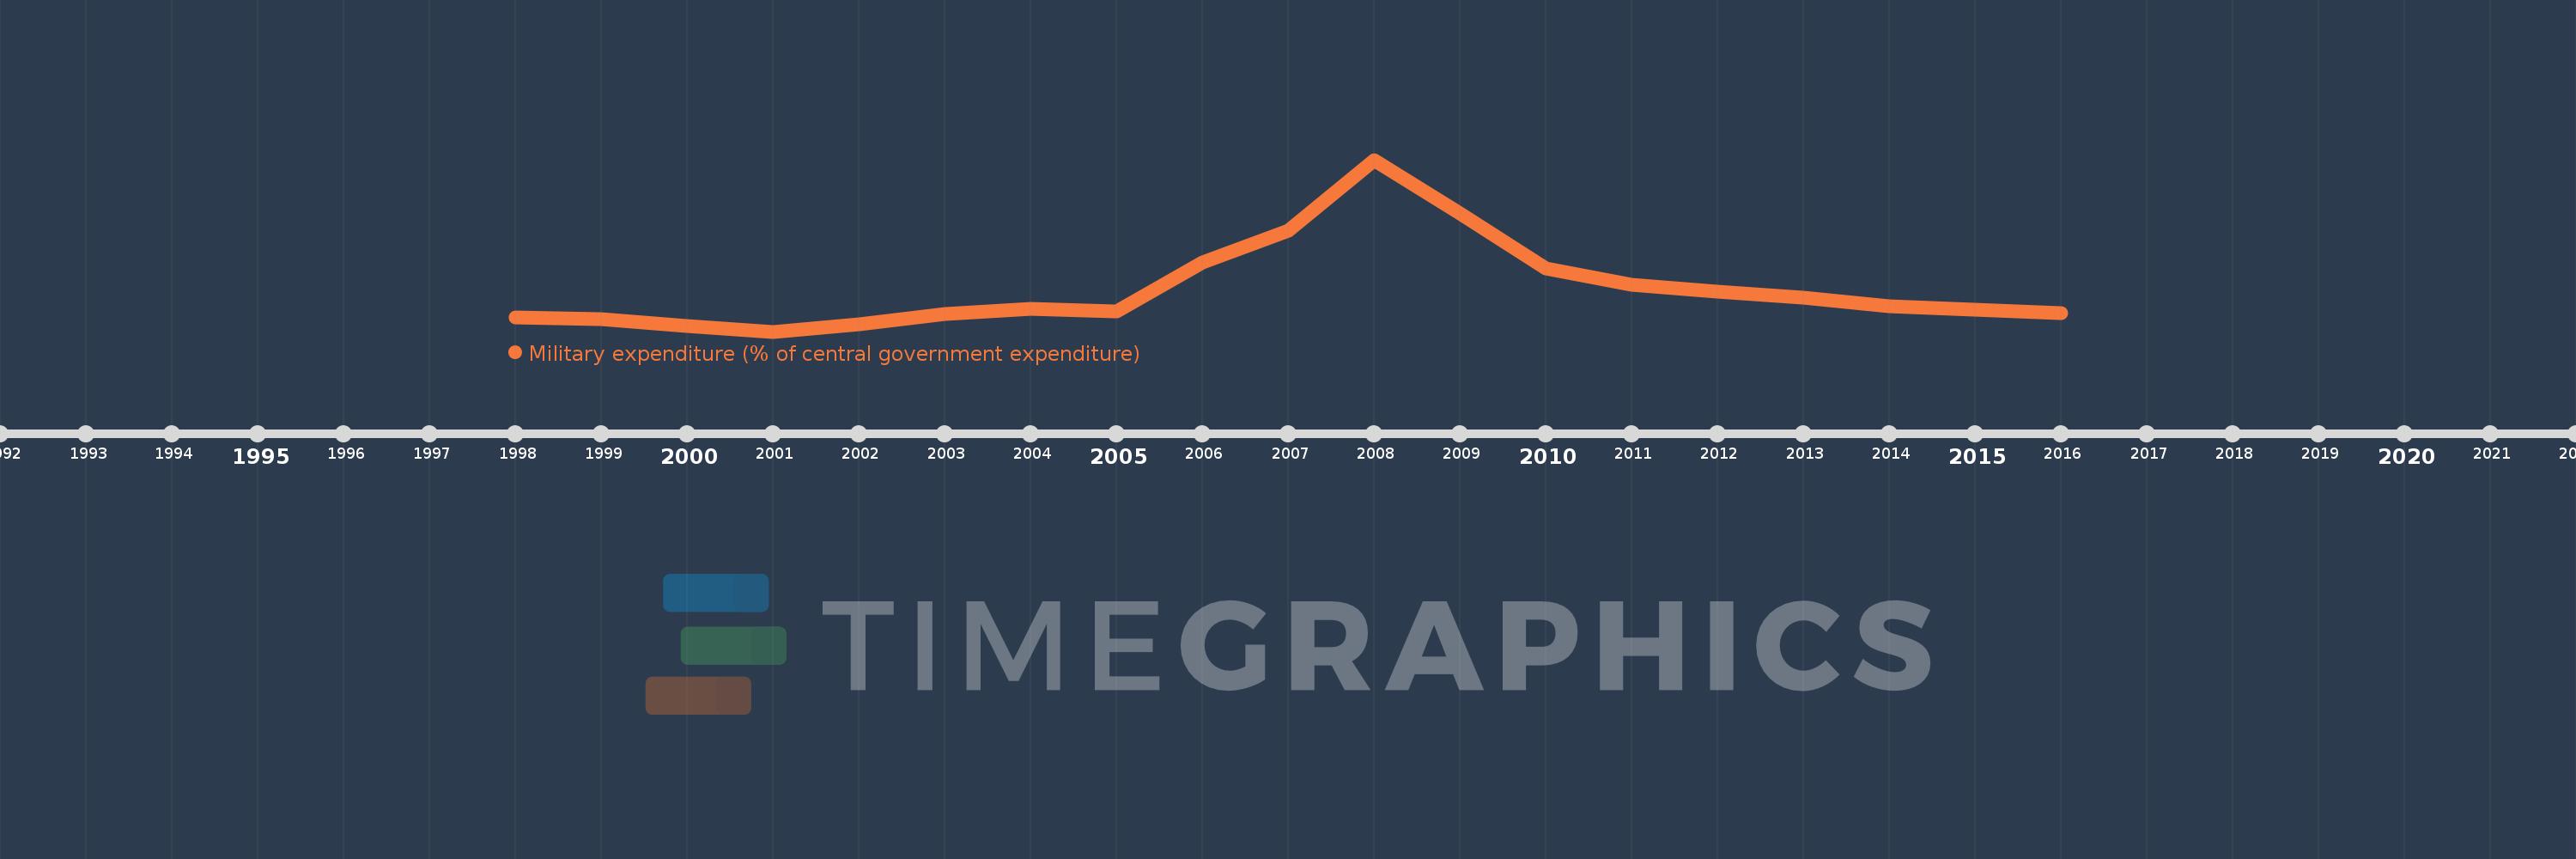
Military expenditure (% of central government expenditure)
2016,2015,2014,2013,2012,2011,2010,2009,2008,2007,2006,2005,2004,2003,2002,2001,2000,1999,1998
This statistics in other country:
Timeline:
This timeline shows a graph from 1998 to 2016 of Georgia. No data until 1997. Number of actual observations by date: 19.
Source name:
World Development Indicators
Source organization:
Stockholm International Peace Research Institute (SIPRI), Yearbook: Armaments, Disarmament and International Security.
Categories, topics:
Public Sector
Last updated:
apr 23, 2017
Indicators value changes by year
Maximum:
40.012
jan 1, 2008
At the date of observation
Value
Absolute change
Change from previous value
jan 1, 1998
8.151
+8.151
0.0%
jan 1, 1999
7.92
-0.232
-2.84%
jan 1, 2000
6.412
-1.507
-19.03%
jan 1, 2001
5.326
-1.086
-16.93%
jan 1, 2002
6.846
+1.519
28.53%
jan 1, 2003
8.884
+2.038
29.77%
jan 1, 2004
9.994
+1.11
12.49%
jan 1, 2005
9.424
-0.57
-5.71%
jan 1, 2006
19.28
+9.856
104.58%
jan 1, 2007
25.699
+6.419
33.3%
jan 1, 2008
40.012
+14.313
55.7%
jan 1, 2009
29.258
-10.754
-26.88%
jan 1, 2010
18.119
-11.139
-38.07%
jan 1, 2011
14.808
-3.311
-18.27%
jan 1, 2012
13.339
-1.469
-9.92%
jan 1, 2013
12.232
-1.107
-8.3%
jan 1, 2014
10.369
-1.863
-15.23%
jan 1, 2015
9.812
-0.557
-5.37%
jan 1, 2016
9.095
-0.717
-7.3%
Ranking of countries by current statistics by years


Comments: