29
/
en
AIzaSyAYiBZKx7MnpbEhh9jyipgxe19OcubqV5w
April 1, 2024
65023
Albania
ALB
true
2
1
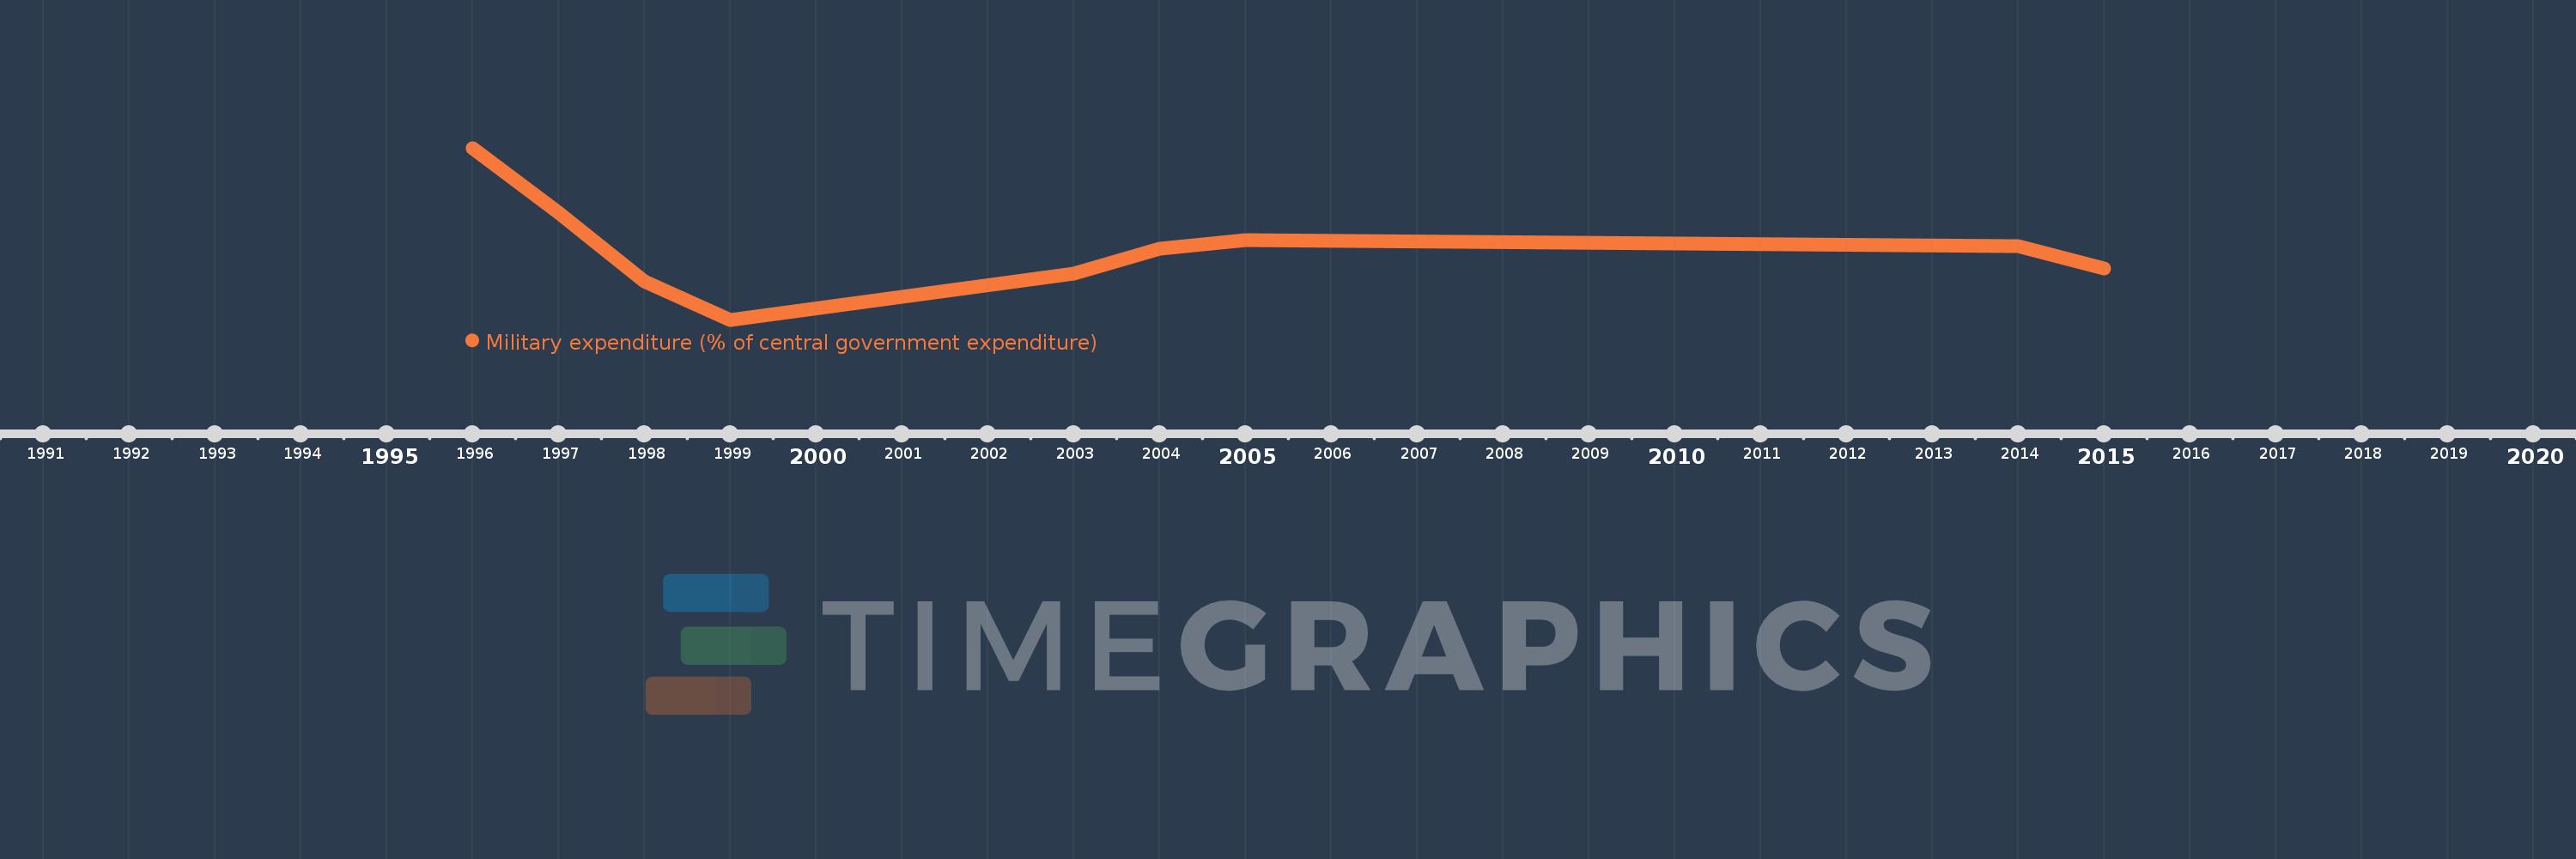
Military expenditure (% of central government expenditure)
2015,2014,2005,2004,2003,1999,1998,1997,1996
This statistics in other country:
Timeline:
This timeline shows a graph from 1996 to 2015 of Albania. No data until 1995. Number of actual observations by date: 9.
Source name:
World Development Indicators
Source organization:
Stockholm International Peace Research Institute (SIPRI), Yearbook: Armaments, Disarmament and International Security.
Categories, topics:
Public Sector
Last updated:
apr 23, 2017
Indicators value changes by year
At the date of observation
Value
Absolute change
Change from previous value
jan 1, 1996
8.217
+8.217
0.0%
jan 1, 1997
6.778
-1.439
-17.52%
jan 1, 1998
5.241
-1.538
-22.68%
jan 1, 1999
4.384
-0.857
-16.35%
jan 1, 2003
5.422
+1.038
23.69%
jan 1, 2004
5.978
+0.556
10.25%
jan 1, 2005
6.169
+0.191
3.19%
jan 1, 2014
6.027
-0.142
-2.3%
jan 1, 2015
5.519
-0.508
-8.43%
Ranking of countries by current statistics by years


Comments: